

Estimating Mill’s climate impact
Mill Background
Mill is a food recycling system designed to keep food out of landfills. Mill combines a food recycler—which dries and grinds scraps into compact, nutrient-rich “Food Grounds”—with optional recycling pathways. These shelf-stable grounds can be composted locally or sent back to Mill to be turned into a chicken feed ingredient.
2023 Scoping Life-Cycle Assessment
Mill uses life-cycle assessments (LCA) to quantify the net carbon avoidance from use of the food recycler. Mill published the original version of its scoping LCA in January 2023. This initial study was completed before any production devices were in use, and was based on early field data.
New Factors Reflected in Updated 2025 LCA
In early 2025, Mill updated its LCA to incorporate new factors, which resulted in slightly different—but more accurate and representative—outcomes. These new factors included:
Operational data: As of June 2025, tens of thousands of food recyclers have been sold and more than one year’s worth of operational data has been gathered from these devices.
New manufacturing, usage, and maintenance footprints of Mill’s second-generation food recycler: In early 2024, Mill began shipping its second-generation device, which is quieter, faster, and more efficient than the first generation. Today, the second-generation device is the most common device in use by Mill customers.
Updated literature: Since the 2023 scoping LCA was published, dozens of reports and literature references have released new versions and methodologies.
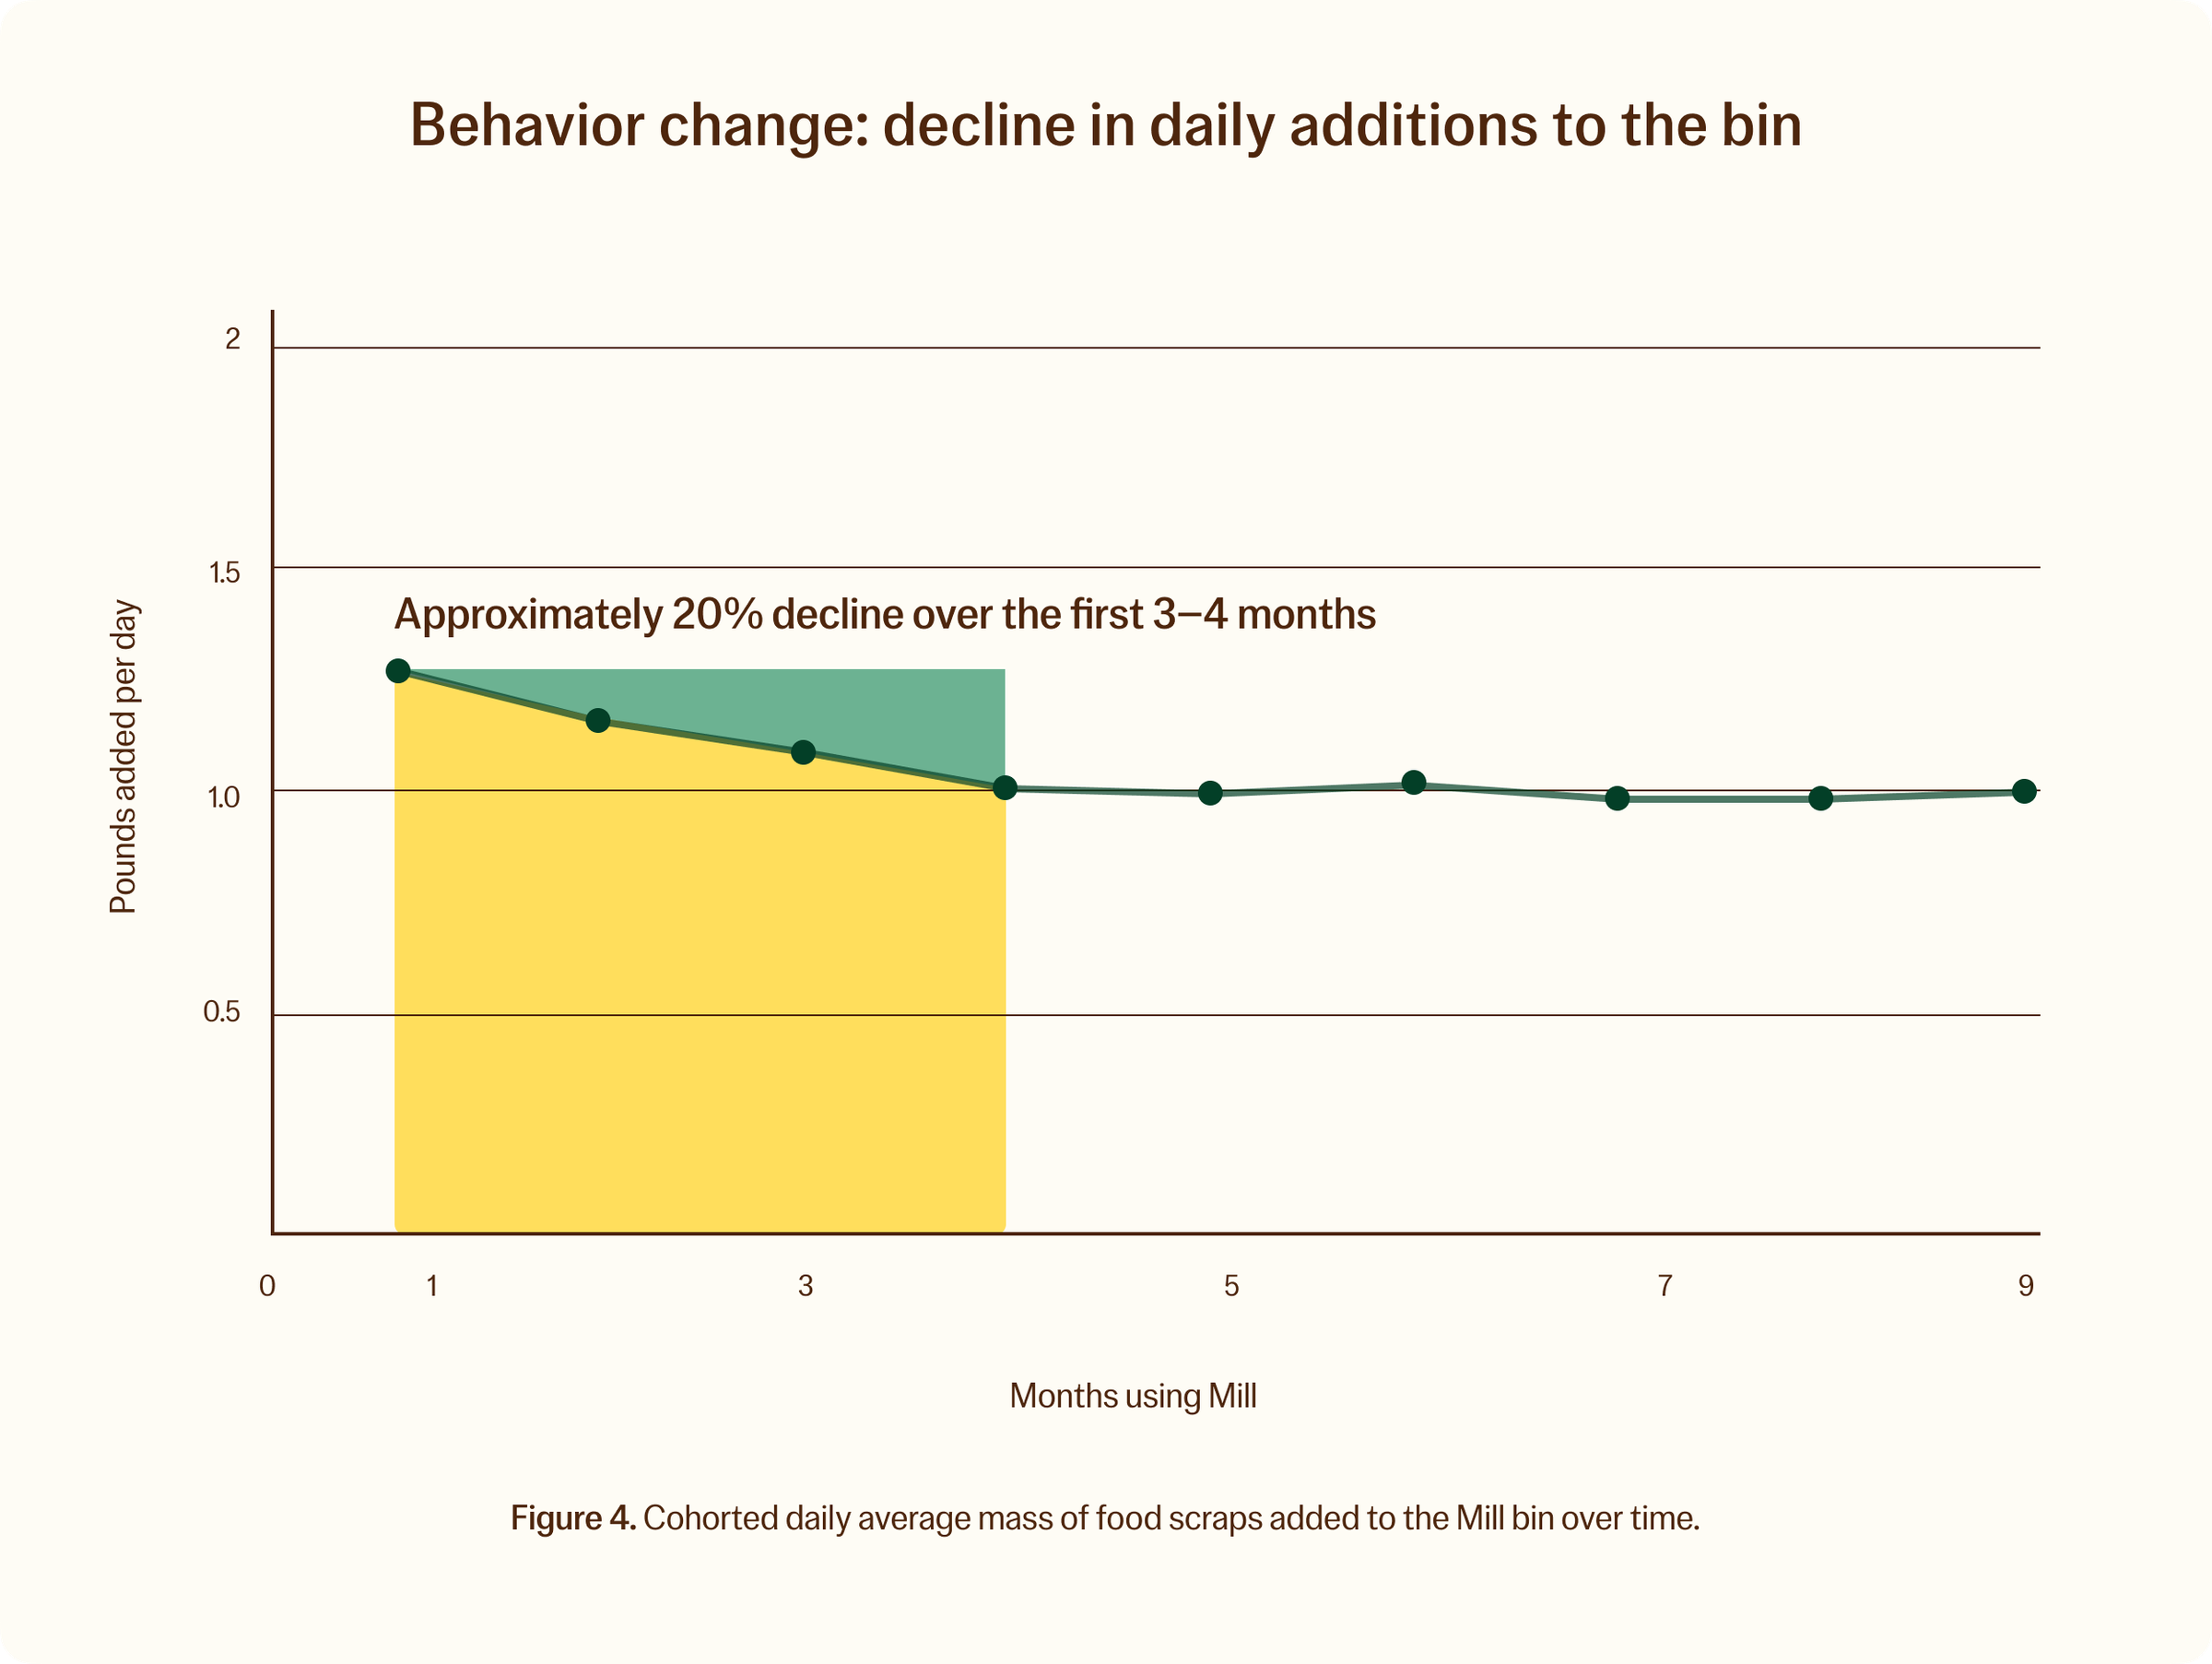
Consumer behavior change: During 2024, Mill observed a consistent customer behavior change (specifically the reduction in the mass of food scraps added to the bin after a few months of use) occurring repeatedly across Mill’s fleet, on a cohort basis (i.e., Mill bin users who paired in a given month). These learnings were accounted for in the new version of the study.
Output pathways: Mill analyzed survey data and customer data to determine changes in how people handled food scraps pre- and post-Mill.
Structural changes based on new data: Structurally, the 2025 model was redesigned to tailor operational use cases to specific customer profiles. The model also needed structural changes to enable the incorporation of new operational and additional literature data.
Updated Findings
When assessing the single scenario modeled in the initial version of the 2023 model (which assumed that before getting Mill, 80% of food scraps were landfilled, and the other 20% were composted, among other assumptions that have since changed), the 2025 model estimates 507 kg-CO2e avoided / device / year. This is slightly less than the 521 estimated in the initial study.
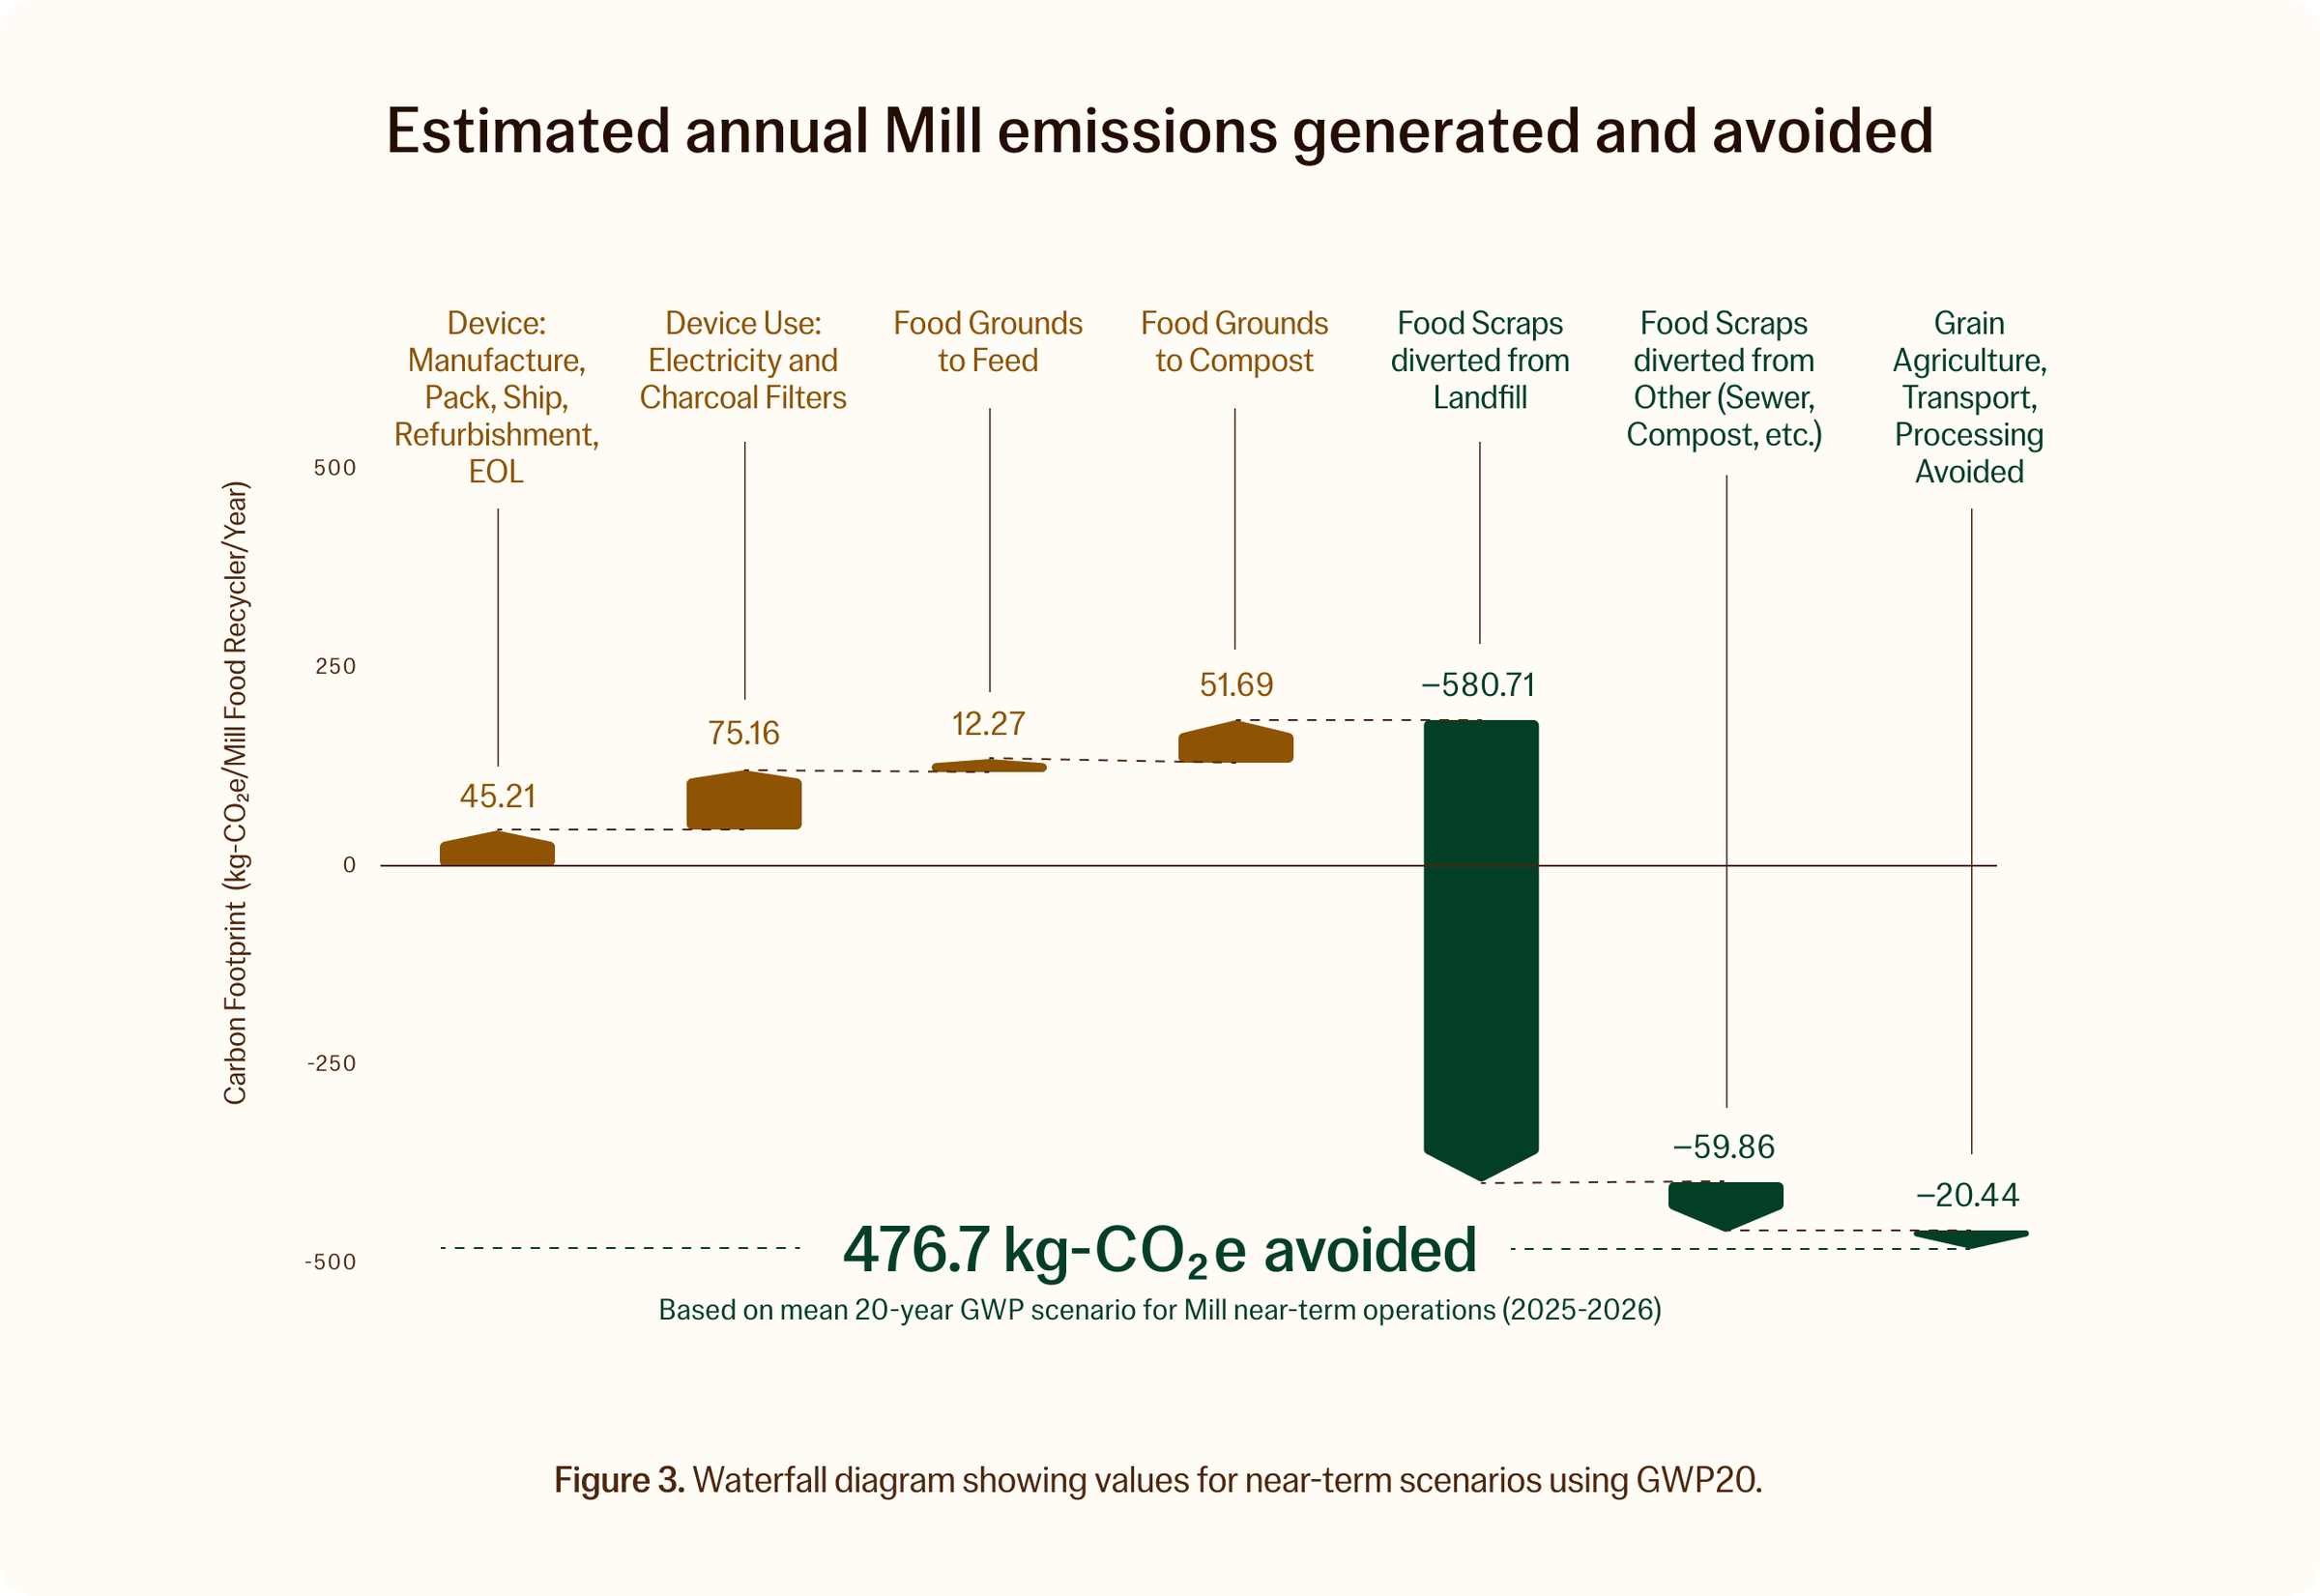
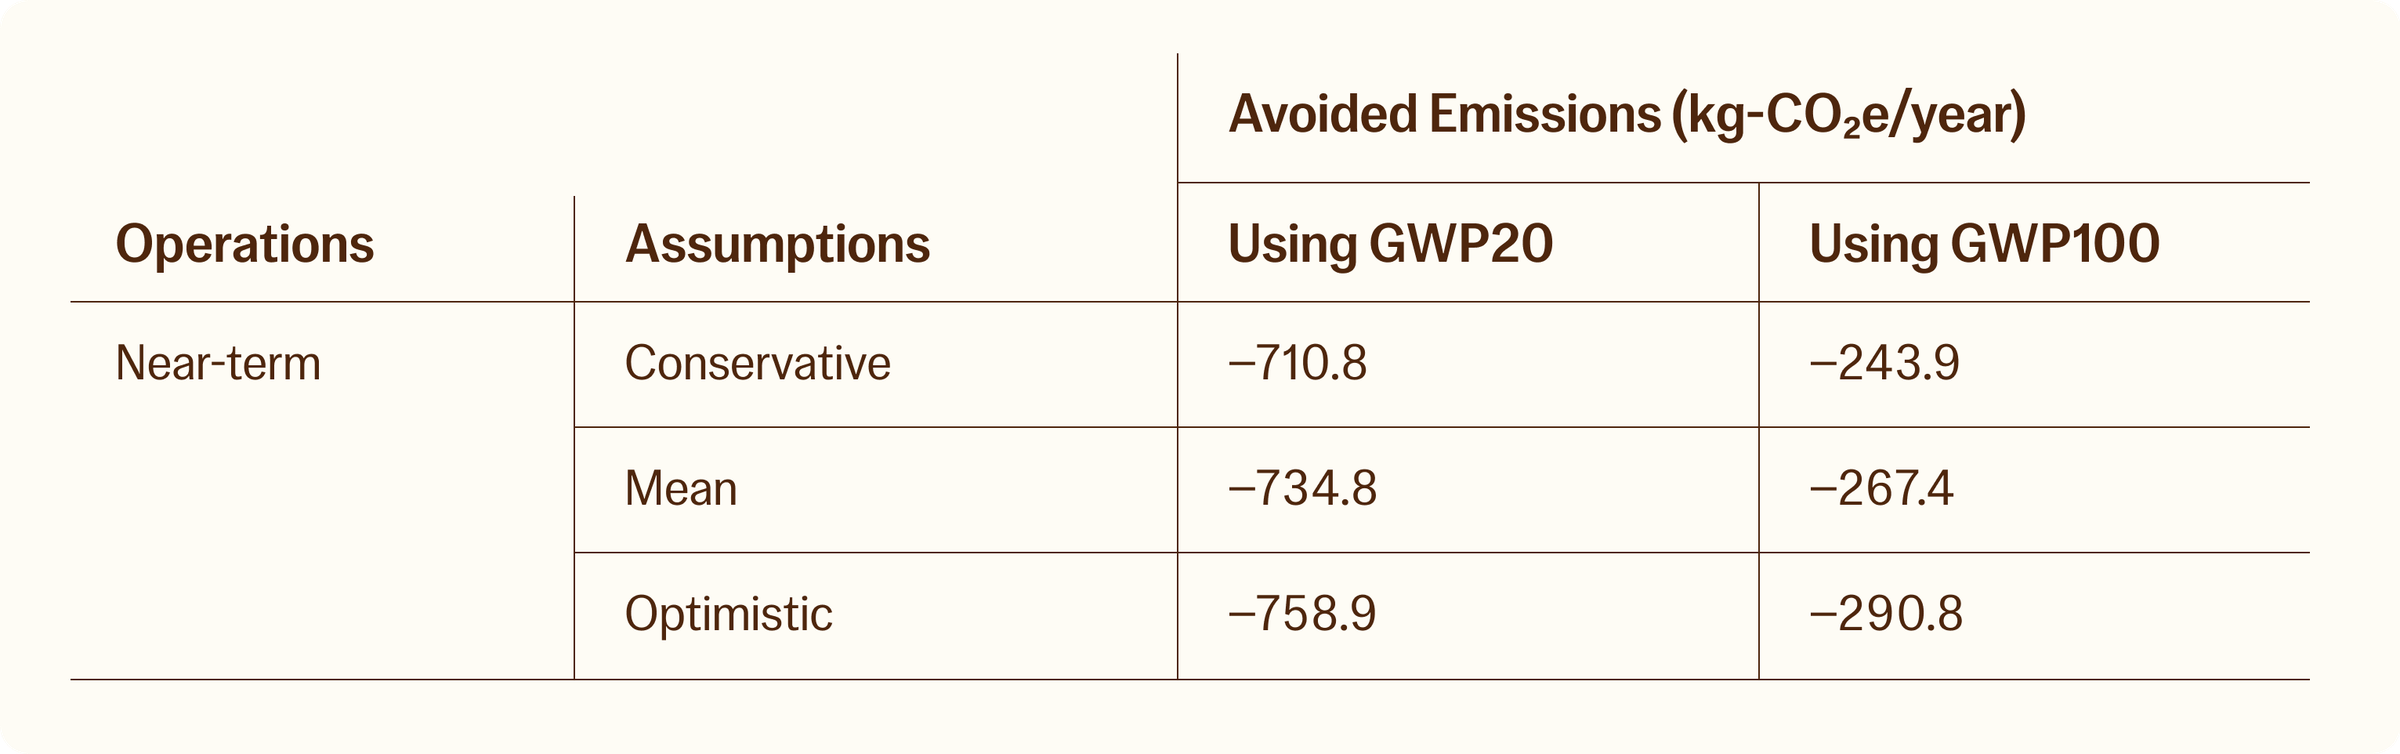
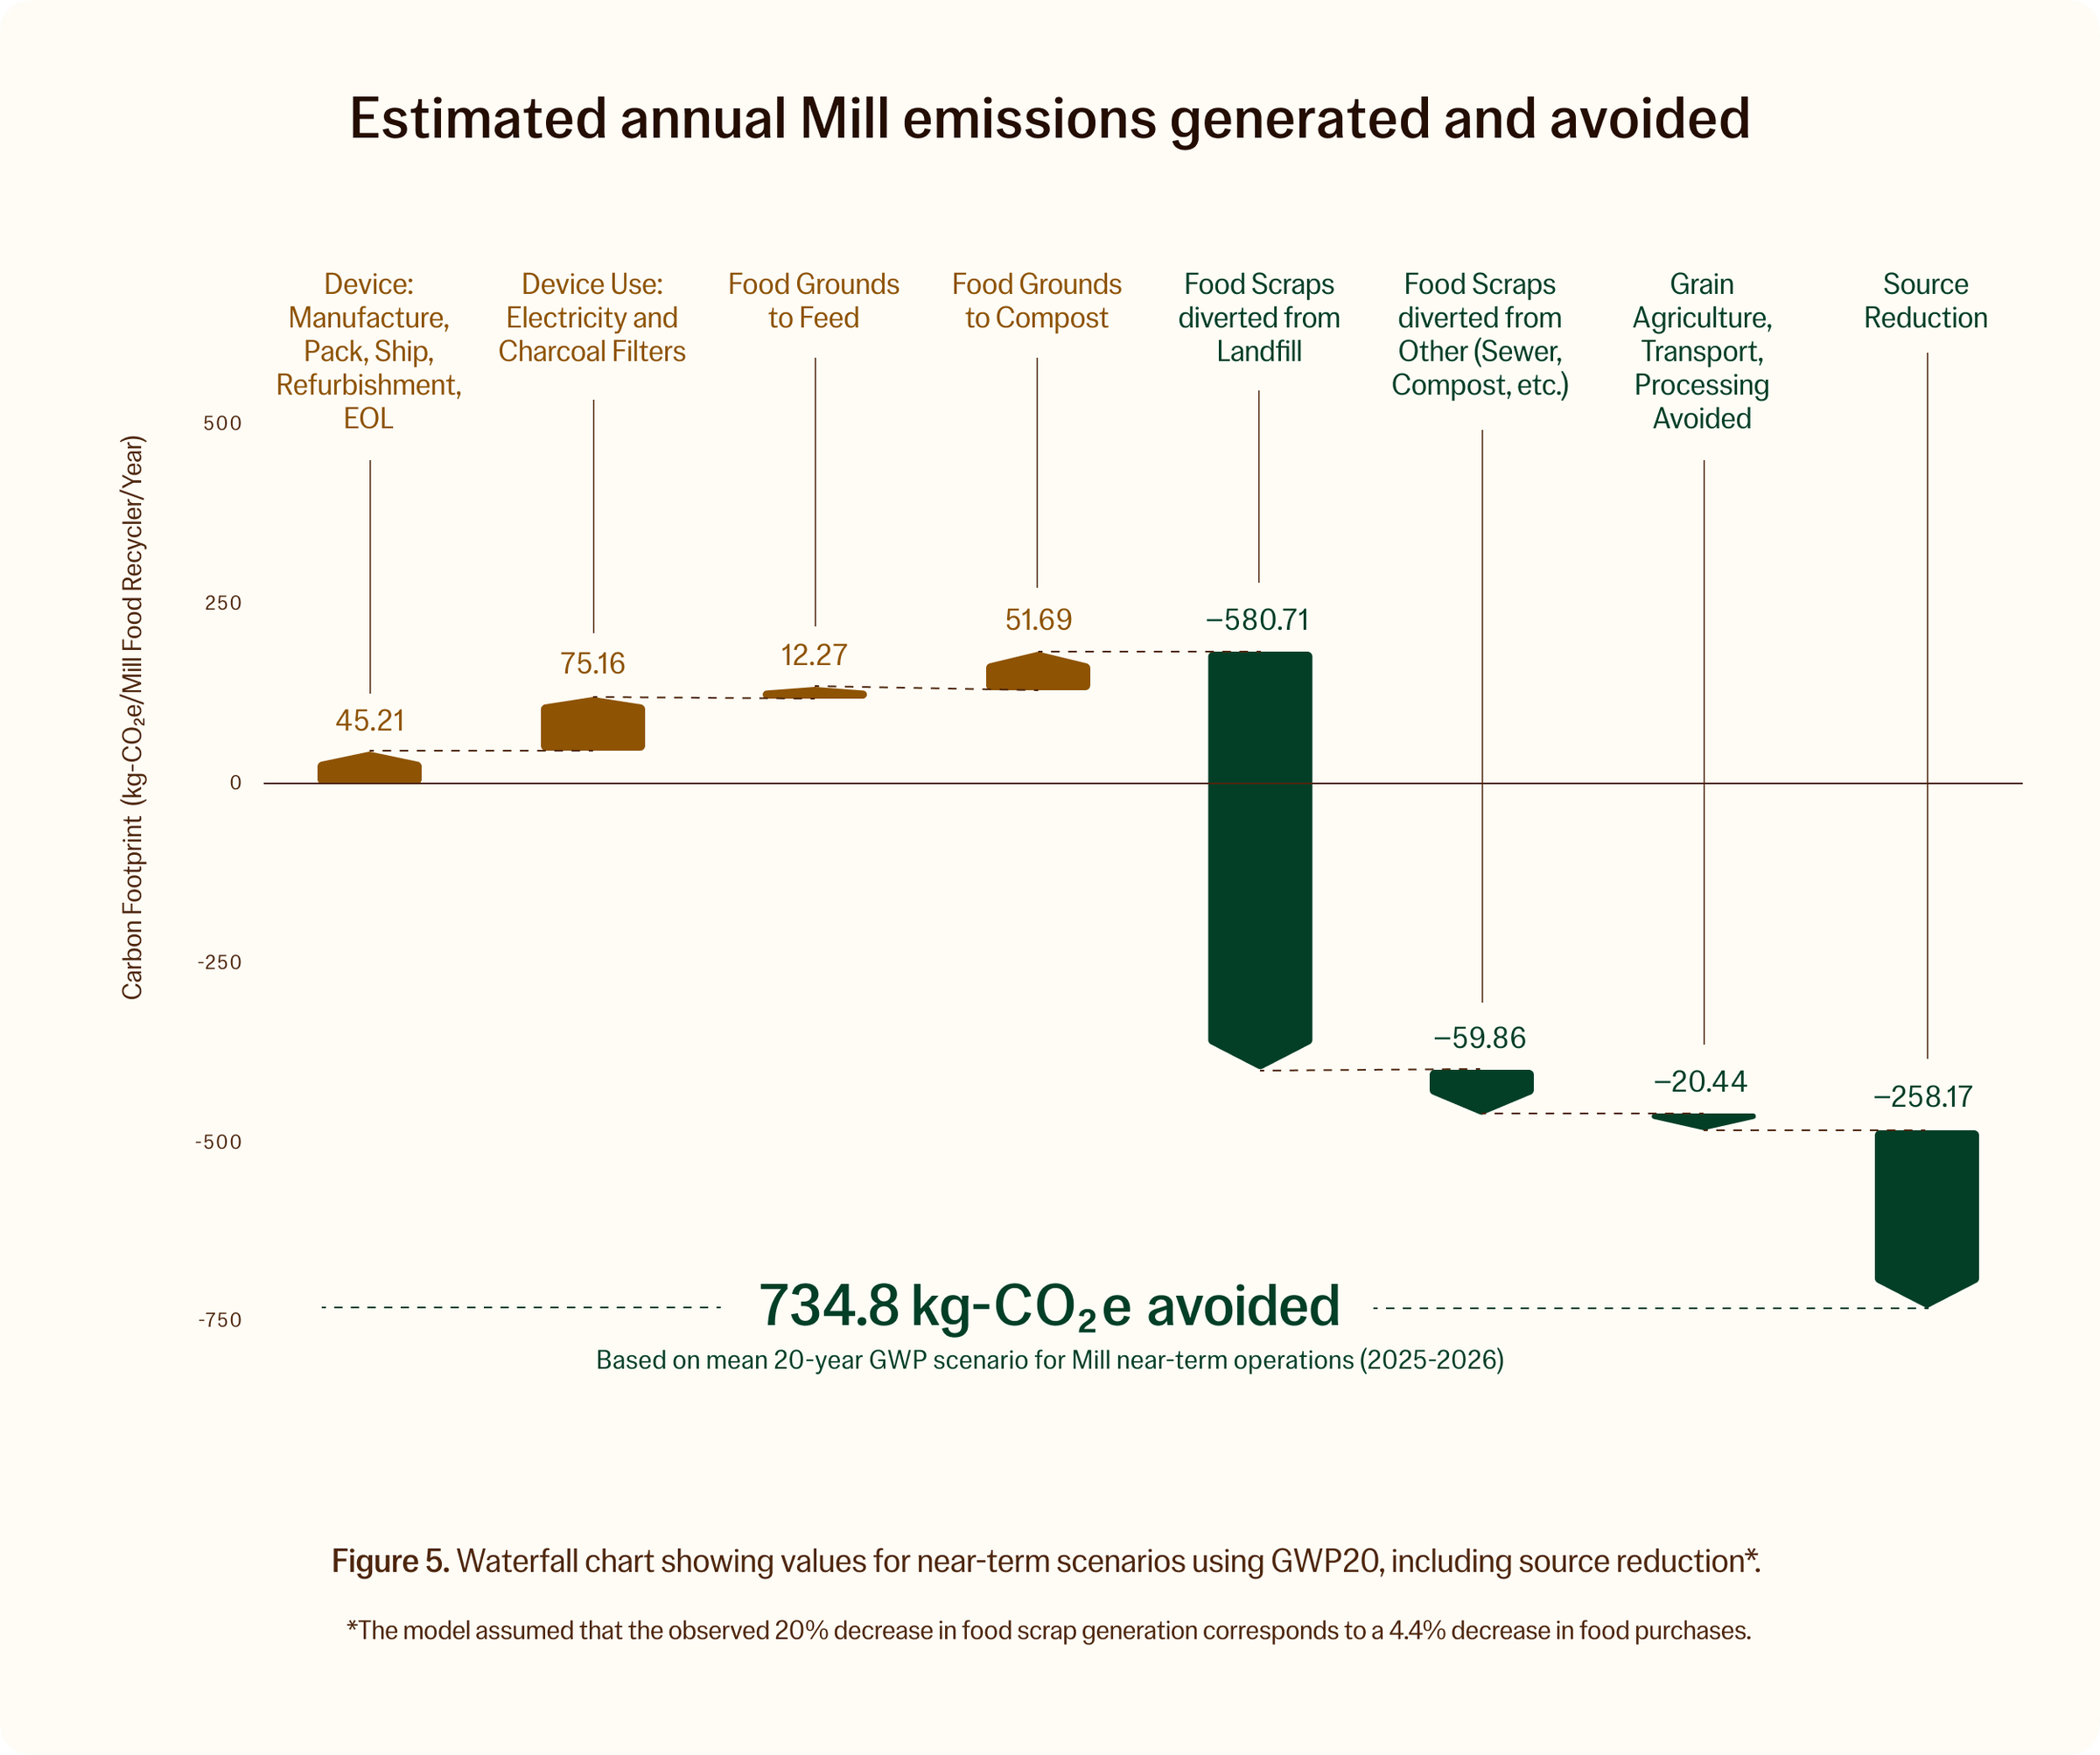
When assessing the scenario reflecting the average U.S. household that becomes a Mill customer, the 2025 model estimates 477 kg-CO2e avoided / device / year for improved scraps management, and a possible 258 kg-CO2e avoided / device / year for source reduction from device engagement-driven behavior change. In total, this represents 735 kg-CO2e avoided / device / year. This is based on EPA data on typical management of residential food waste in the U.S., and recent survey data of how Mill customers manage their Food Grounds.
When assessing the scenario where a household was landfilling all of their scraps before Mill, and now sends all of their Food Grounds back to Mill to be turned into poultry feed, the 2025 model estimates 899 kg-CO2e avoided / device / year (641 kg-CO2e for improved scraps management + 258 kg-CO2e for source reduction).
According to our 2023 and 2025 models, a counterfactual world without Mill appears to incur a much greater cost to our climate than a world with Mill. In other words, the emissions avoided by Mill are greater than the energy and resources invested for Mill to operate.
At Mill, we’re on a mission to keep food out of landfills.
Uneaten food is the most common material in landfills and most of it comes from households. When that food decomposes in a landfill, it produces methane, a greenhouse gas that has about 80x the global warming potential of carbon dioxide over a 20-year period.
Mill combines a food recycler—which dries and grinds scraps into compact, nutrient-rich “Food Grounds”—with optional recycling pathways. Shelf-stable Food Grounds can be composted locally, fed to backyard chickens, used directly in a garden, or sent back to Mill, where they are turned into food for chickens.
We use a life-cycle assessment (LCA) to quantify the annual climate impact of the Mill Food Recycler. Based on our preliminary study, a household can avoid about one-half of a metric ton of carbon dioxide per year by using Mill.
By publishing our estimates, we invite people to help shape how we think and how we outsmart waste. In the future, as we gather data from households with Mill, we will be able to report on impact in more detailed ways. This updated 2025 study is the first step in doing so. We anticipate our numbers may continue to change as members reduce the food scraps they generate and as sending food to landfills becomes less common in the U.S. in the future.
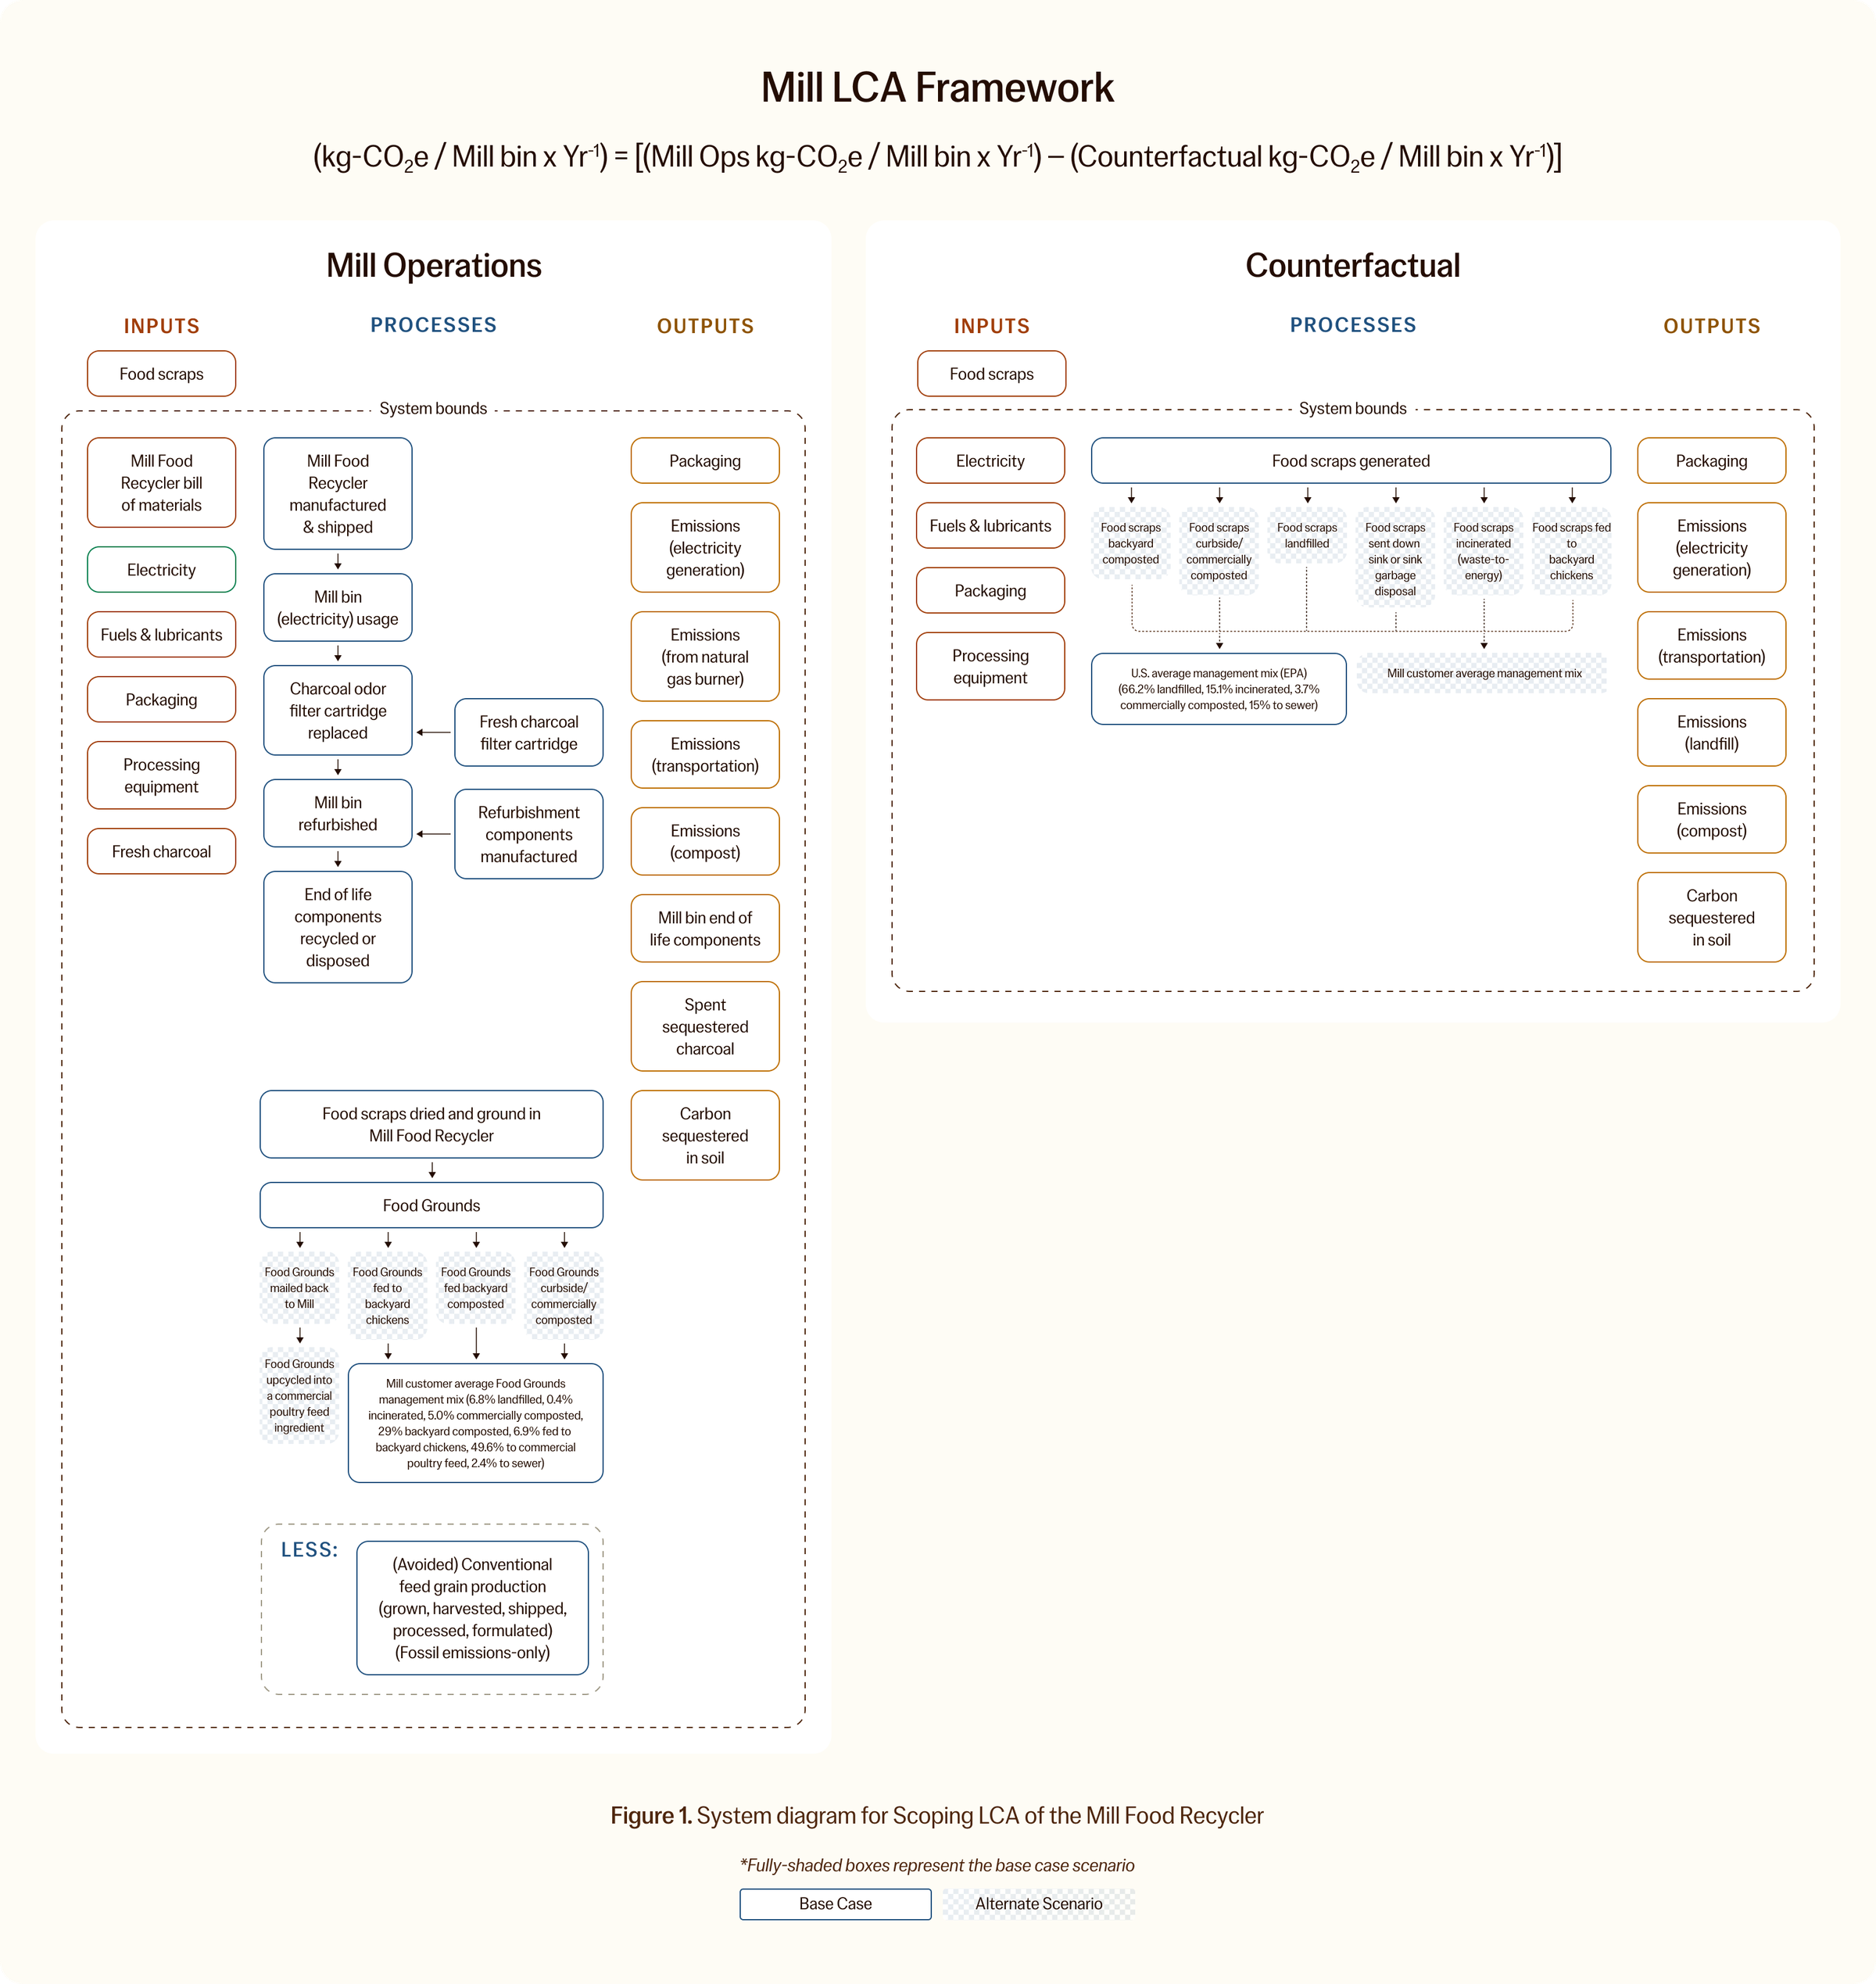
Our Scoping LCA is a cradle-to-grave comparison of the Mill Food Recycler (that includes the Mill Food Recycler, Mill’s Food Grounds operations, and other Food Grounds management methods) to a counterfactual scenario before having Mill in the home (where food scraps are landfilled or composted, for example).
We describe emissions avoided, where one year of Mill Food Recycler use is the functional unit, and kilograms of CO2 equivalents (kg-CO2e) is the environmental indicator.
Cradle-to-grave describes the upstream and downstream extents of the system boundaries, specifically inclusive of extraction of raw materials (to manufacture the bin) through the final fate of the food scraps or Food Grounds-derived products.
This write-up reflects an updated version of the study, completed in February 2025 (referred to as the 2025 model here on), and replaces the original study, published in February 2023 (referred to as the 2025 model here on).
Reviewers of the 2025 scoping LCA model
EarthShift Global: a leading professional LCA services firm, carried out a detailed review of the 2025 Scoping LCA, specifically reviewing the structure, assumptions, data sources, and calculations. EarthShift Global noted that “The issues raised have been properly addressed.”
Reviewers of the 2023 scoping LCA model
Franklin Associates: a division of Eastern Resource Group (ERG) who we are working with to inform our LCA model and to guide future developments and results benchmarking.
Synapse Product Development: a professional engineering services firm with expertise in sustainable design practices that built a SimaPro life-cycle assessment to account for the carbon emissions of the materials and manufacturing of the device and its components.
Energy Impact Partners (Mill investor): a strategic investment firm with a team of LCA experts who reviewed our model structure and transportation calculations.
Dr. Michael Walsh: a decarbonization researcher who reviewed our landfill and compost calculations.
We carried out a series of literature reviews to identify the most reputable references available for impact accounting methodologies, assumptions, and emission factors. We then evaluated two scenarios:

Here are the definitions for each scenario:
Near-term operations
Refers to less optimized Mill operations projected for the beginning of 2025 through the end of 2026 where resource efficiency, energy efficiency, transport distances, and manufacturing have room for improvement with time and product/process refinements.
Conservative assumptions
Selected to emulate a more pessimistic scenario, where processes are, for example, assumed to be inefficient, energy-intensive, geographically further apart, and products are shorter-lived and heavier. Often, current operational efficiencies were used for conservative assumptions. Because Mill has a continuous improvement culture, most of the current operational efficiencies will only improve over time, and can be considered worst-case scenario values.
Optimistic assumptions
Selected to emulate a more optimistic scenario, values were selected that were considered by the engineering and operations teams to be realistically achievable within the near-term timeline (over the next two years).
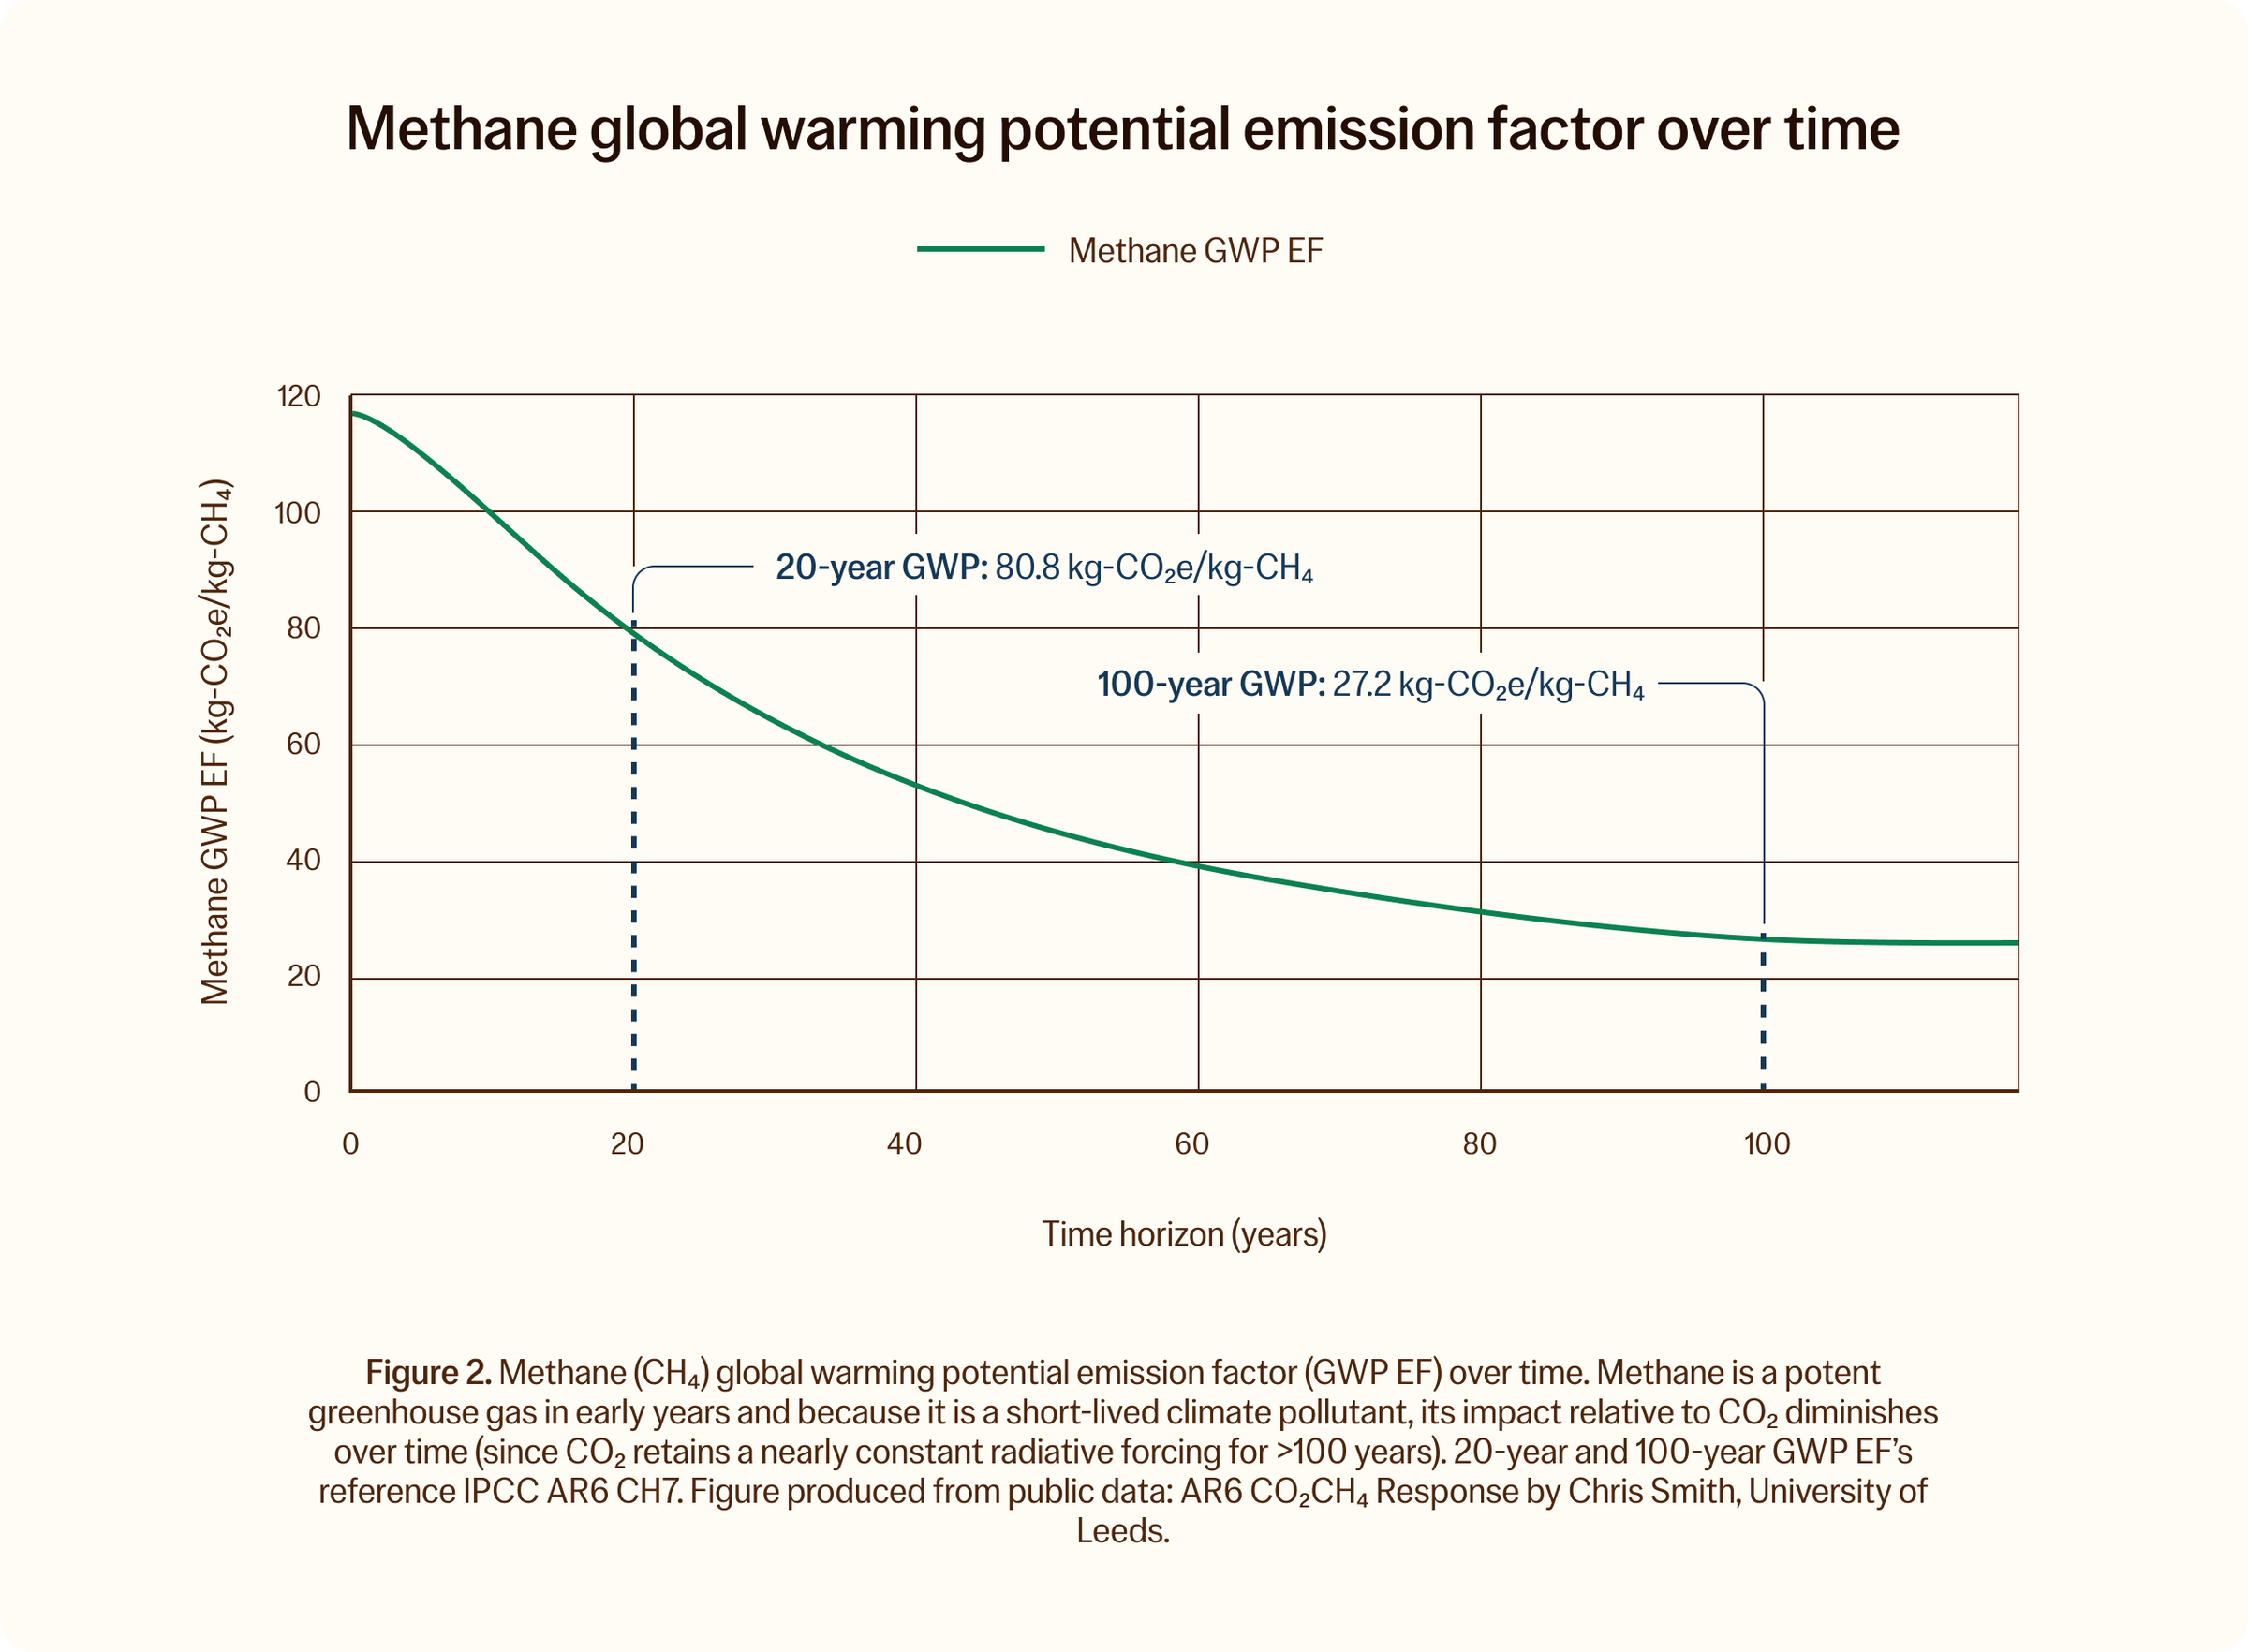
We conducted our Scoping LCA using both 20-year and 100-year global warming potentials (GWP20 and GWP100). This means that we applied emission factors (EF) with 20- and 100-year time horizons to convert the mass of non-CO2 greenhouse gases (GHGs) into CO2-equivalents (CO2e). Using both GWP20 and GWP100 to calculate avoided CO2e emissions allows us to understand our climate impact on both a short-term and long-term timescale[1].
IPCC classifies methane emission factors as either biogenic emissions or fossil emissions. Biogenic emissions are the emissions produced from a biological process, such as methane emitted from anaerobic decomposition. It is common in LCAs to omit biogenic CO2 emissions from materials of recent biological origin, such as CO2 emissions from composting, because it is considered to be a part of the short-term carbon cycle. Fossil emissions result from the combustion or oxidation of fossil fuels, such as burning jet fuel. Because fossil CO2 is not part of the short-term carbon cycle, it is accounted for in the model.
GWP20
EF 80.8 for biogenic methane with 20-year time horizon (IPCC AR6 Ch7 Table 7.15).
GWP100
EF 27.2 for biogenic methane with 100-year time horizon (IPCC AR6 Ch7 Table 7.15).
ISO-compliant LCAs typically use the 100-year time horizon because it is a round number historically used by other LCA studies.
The stark difference in methane GWPs over different time frames is due to the fact that methane is relatively short-lived in the atmosphere, sticking around for roughly a decade (as compared to over a century for CO2). During its short atmospheric life, methane traps significantly more heat than CO2, thereby increasing the risk of passing potentially catastrophic climate tipping points. Even though CO2 has a longer-lasting effect, methane sets the pace for warming in the near term.
In 2018, Balcombe and colleagues did a deep dive on the appropriate uses of the 20- and 100-year methane GWP emission factors. They found that although reporting both is the safest approach, the 20-year factor was appropriate for assessing the impact of technologies targeted at mitigating methane emissions (Balcombe et al., 2018).
[1] For activities that do not emit methane, the same EF was used for both the 20- and 100-year GWP scenarios, as most other non-CO2 greenhouse gases are long-lived in the atmosphere, and the relative amounts of heat trapped do not significantly vary between 20- and 100-year time horizons.
It is important to re-emphasize that this is a scoping study, and that Mill made a best-faith effort to build a holistic model with fair assumptions based on our knowledge today. The 2025 model incorporated more than a year of production device operational data. This production data included food scrap generation behavior, device electricity use, and hardware maintenance frequency, for example. That said, our inputs will continue to change in the future as the product offering evolves, and as we continue to learn more about human food scrap management behavior.
When taking the difference in the CO2e impact between the counterfactual and Mill, we can quantify the emissions avoided by the use of a Mill Food Recycler (in the unit of kg-CO2e/year). Ranges, showing the values between conservative and optimistic scenarios, frame the range of possible outcomes under a given set of conservative and optimistic assumptions. For simplicity, when a single number is reported for a use case scenario, this reflects the average of the conservative and optimistic scenarios.
According to our scoping LCA, a counterfactual world without Mill appears to incur a much greater cost to our climate than a world with Mill. In other words, the emissions avoided by Mill are greater than the energy and resources invested for Mill to operate. Landfill emission avoidance is, in the base case scenario, the largest contributor toward the net environmental benefit of a Mill Food Recycler.
Below is a summary of outcomes for the base case scenario*:
*The base case scenario assumes scraps were managed in accordance with the U.S. average residential food scraps management mix (according to 2019 EPA data), and the Mill customer average Food Grounds management mix (based on January 2025 customer survey data). See the Impact Matrix appendix below for impact estimates of additional scenarios. The values shown in the table account for both improved scraps management (476.7 for the mean) and source reduction from engagement-driven behavior change (258.2 for the mean).
Below is a waterfall chart showing the breakdown of the impact of the base case scenario:
Source reduction is a potential source of impact that can be realized by a household using Mill. Source reduction is the prevention of waste through a decrease in the amount of food purchased, or more precisely, a decrease in the demand for food supply. Source reduction is highly impactful because it avoids all upstream activities - from cultivation and harvesting to processing to transportation and storage. Because of the high carbon footprint of the food supply chain, reducing one pound of food is many times more impactful than keeping one pound of food out of the landfill.
Because the Mill Food Recycler detects all food scrap mass additions, using an internal scale with a 15 gram sensitivity, Mill has gathered unique insights into food scrap generation behavior.
One such insight is the tendency for customers to experience a reduction in the mass of food scraps added to the Mill bin (by approximately 20%) over the first few months with the Mill Food Recycler in the home. The behavior change is observed consistently on a cohort basis, fleetwide. Because it is assumed that customers do not begin consuming more food once they have a Mill bin in their home, the reduction in food scraps observed might be attributable to a slight decrease in the quantity of food purchased. This theory is supported by survey data where a large portion of respondents cite changes in food preparation behavior, and a reduction in the food wasted following the adoption of Mill. A small portion of Mill customers noted a reduction in purchases of food consumed at home.
This also assumes that the 20% reduction in mass additions to the bin was not attributable to an increase in placing those food scraps in the garbage. This assumption is supported by an increase in Mill customer Net Promoter Score, a metric used to quantify customer satisfaction with a product or service, over the same period. Further, engagement, defined by the number of lid-opens per week, remains consistent over the same period, suggesting that this decrease in mass additions is not attributable to less use of the bin.
A 20% reduction in food scraps generated was estimated to equate to a 4.4% reduction in food purchases - which may not be detectable to the average household given week-to-week fluctuations in purchases. Even with this supporting evidence, the extent to which source reduction typically occurs has not been validated.
Below is a waterfall chart showing the breakdown of impact from near-term scenarios with source reduction included:
We organized the results from Mill Food Recycler operations into the following groups:
Device: manufacture, package, ship, refurbishment, and End-of-Life (EOL) management
Scope: Includes Mill Food Recycler manufacturing (extraction and processing of raw materials, component manufacturing, and assembly), packaging, energy to transport the bin to the customer’s home, reverse (and subsequent forward) logistics for bin refurbishment, manufacture and assembly of components replaced during refurbishment, and management of end-of-life components.
Result: The majority of the impact of this process group can be attributed to the annualized impact of manufacturing the bin. Refurbishment activities are the secondary source of impact.
Device use: electricity usage & charcoal filter replacement
Scope: Includes electricity consumption during normal bin use as well as the production and shipping of replacement charcoal odor filter cartridges.
Results: Electricity consumption is the primary source of emissions for this process group. It is also the primary source of emissions for the Mill bin overall, although still small relative to the counterfactual.
Food Grounds to feed
Scope: Includes the emissions invested to make Food Grounds mailer boxes and liners, to ship multipacks of mailers to member homes, and to ship Food Grounds-filled mailers back to Mill’s feed ingredient manufacturing facility. It also includes the energy used by the manufacturing facility, and to ship the feed ingredient to a
formulator.
Result: Although the impact of shipping is non-zero, it is small relative to the bin’s electricity use. By leveraging trucks that are already on the road, shipping transport emissions are measured as nominal ton-miles – the energy to carry the additional mass of Food Grounds from the home to the feed ingredient manufacturing facility. Shipping Food Grounds is more impactful (has a greater GHG impact) than the feed ingredient manufacturing process.
Food Grounds to compost
Scope: Includes the emissions resulting from backyard composting as well as commercial composting of Food Grounds (and the transport to the facility). Compost process fugitive emissions (non-CO2 biogenic emissions) are also accounted for.
Result: Composting (both commercial and backyard) is typically an approximately net-neutral process (the small quantity of fugitive emissions are typically offset by the small portion of compost carbon which becomes sequestered in the soil which the compost amends), so it has a negligible impact on the LCA overall.
We organized the results from the counterfactual in the following groups:
Food scraps kept out of landfill:
Scope: This process estimates the impact of landfilling food scraps before Mill. This includes the collection and transportation of scraps to the landfill, landfilling biogenic methane release, and emissions from landfill equipment. The portion of food scraps that were landfilled before Mill was estimated based on EPA residential food waste management data FY2019, reflecting the behavior of the average U.S. household.
Result: This is typically the greatest source of impact in the whole system. Because of its potency, the modest mass of methane emitted from landfilling one household’s food scraps (roughly 10 - 20 kg of methane) results in hundreds of kilograms of CO2e. The portion of food scraps landfilled were sourced from an April 2023 EPA report (2019 Wasted Food Report). The landfill emissions calculations were based on an October 2023 EPA report (Quantifying Methane Emissions from Landfilled Food Waste). The model accounts for landfill gas capture, methane oxidation (to CO2) in the near-surface of the landfill, landfill gas electricity generation, and the non-captured methane released to the atmosphere. See the Landfill Methane section below for more information.
Avoidance of other food scraps management methods:
Scope: This process estimates the impact of all raw food scraps that weren’t landfilled before getting Mill. It calculates this impact by referencing EPA’s 2019 Wasted Food Report for the relative portions of U.S. residential food scraps managed by different methods. It includes food scraps sent to waste-to-energy waste incineration facilities, food scraps backyard and commercially composted, feeding raw scraps to backyard chickens, putting food scraps down the sink or sink garbage disposal, and scraps anaerobically digested. The impact of transportation, fugitive emissions, fossil process emissions, electricity generation credits, and any carbon sequestration that results are all accounted for in these pathways.
Result: Of all of the food scrap management methods described in this process, sending food down the sink or sink garbage disposal was estimated to be the most impactful per pound of food (although less impactful than landfilling food). Because much more food is typically landfilled than is sent down the drain (and because the non-sink management methods for managing food scraps have relatively lesser impact), this process was not nearly as impactful as landfilling food scraps.
Conventional feed production avoided:
Scope: For Food Grounds turned into a commercial feed ingredient, or those fed directly to chickens, some conventional feed is displaced. This process estimates emissions avoidance from that displacement. It includes conventional grain agriculture, grain transport, grain processing into a feed ingredient, and transport to a customer.
Result: Most of the impact results from grain agriculture. Transport and processing are relatively efficient on a mass basis (per pound of grain, for example).
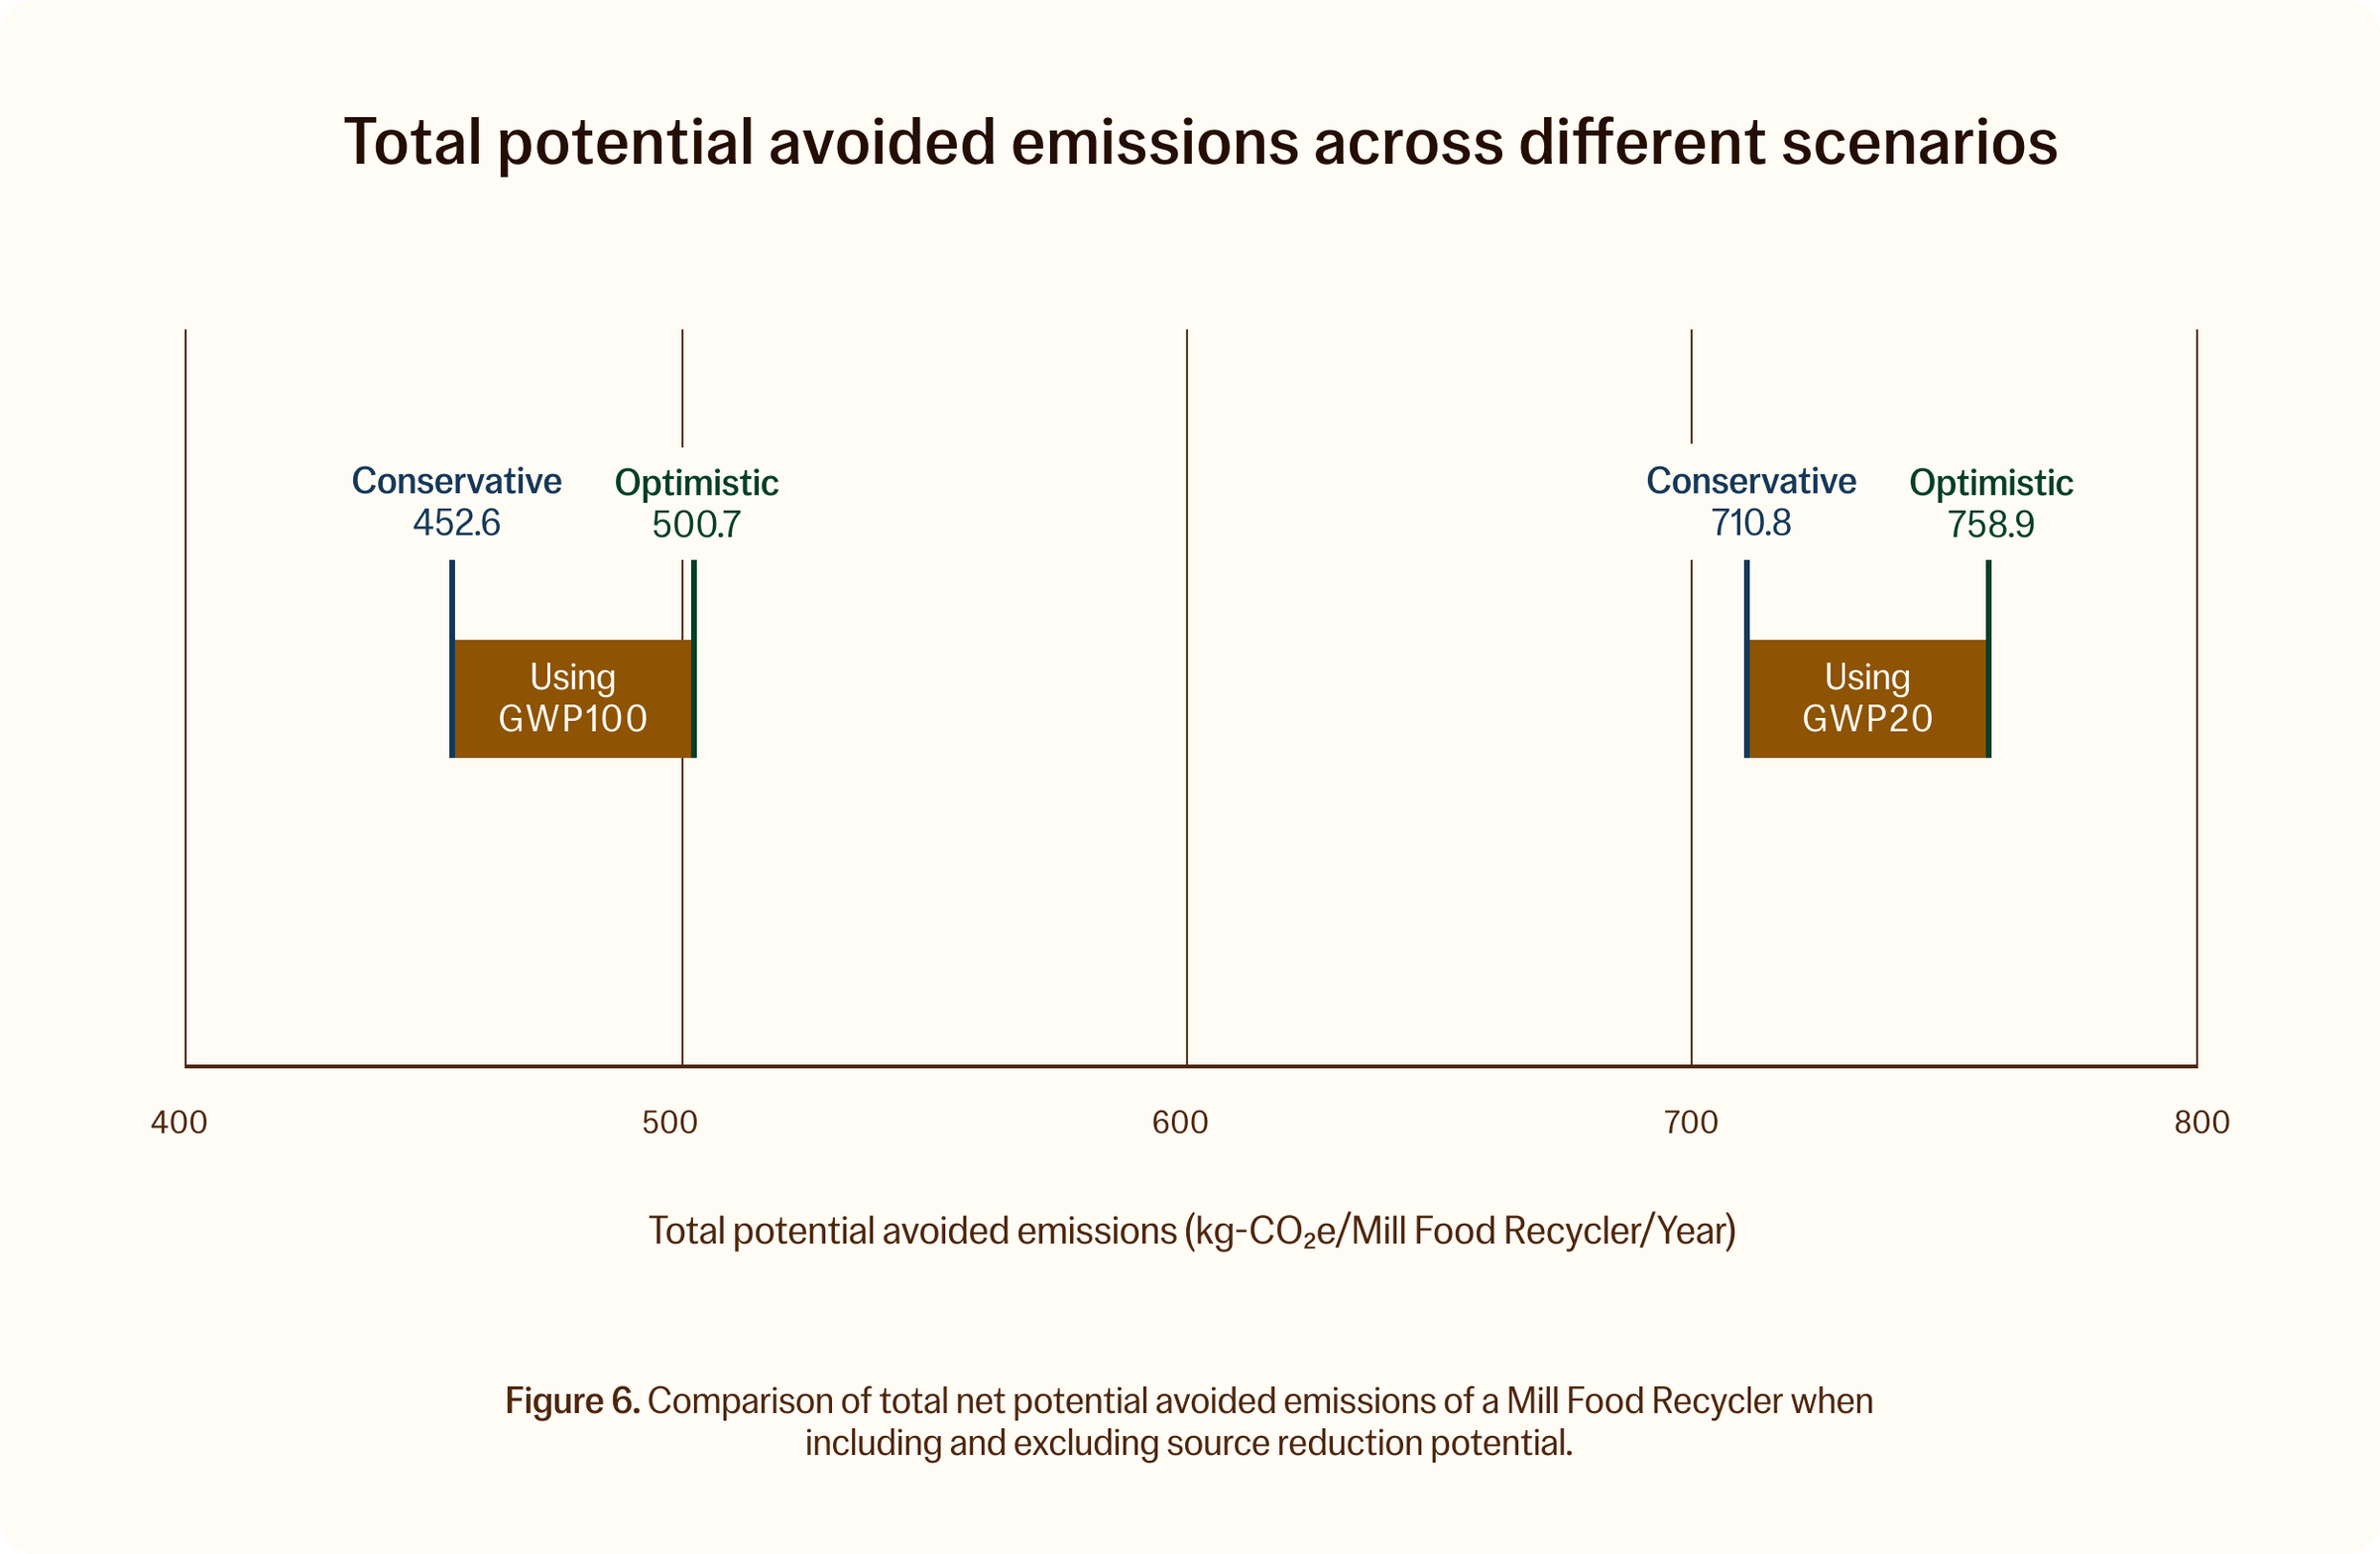
Below is a chart of the results for each scenario using GWP20 and GWP100:
As an efficiency-driven climate-tech company, there are numerous opportunities to drive down the greenhouse gas emissions associated with the device and device use, as well as optimize the process.
Below are a few key areas which Mill has been, and will continue to improve upon:
Improving the efficiency of Mill Food Recycler production and operation.
e.g. firmware improvements reducing power consumption per cycle
Improving logistics related to Food Grounds shipping and feed ingredient distribution.
e.g. facility siting
Improving the energy efficiency of our facilities.
e.g. procurement of renewable energy
Exclusions
Some activities are excluded from the 2025 model:
The climate impact of Mill corporate operations is outside the scope of this study.
Land use and soil carbon implications of offsetting feed grain agriculture.
Indirect effects from Mill operations, such as economic benefits in localities of Mill offices or feed ingredient manufacturing facilities.
Key Assumptions
As with any model, decisions must be made about what falls within the bounds of the assessment, and what fair assumptions can be made about material flows, process activities, and accounting methods. The following section walks through the inputs and assumptions to which the model is most sensitive. See the Sensitivity Analysis section below for details on the relative sensitivity of the model to key inputs.
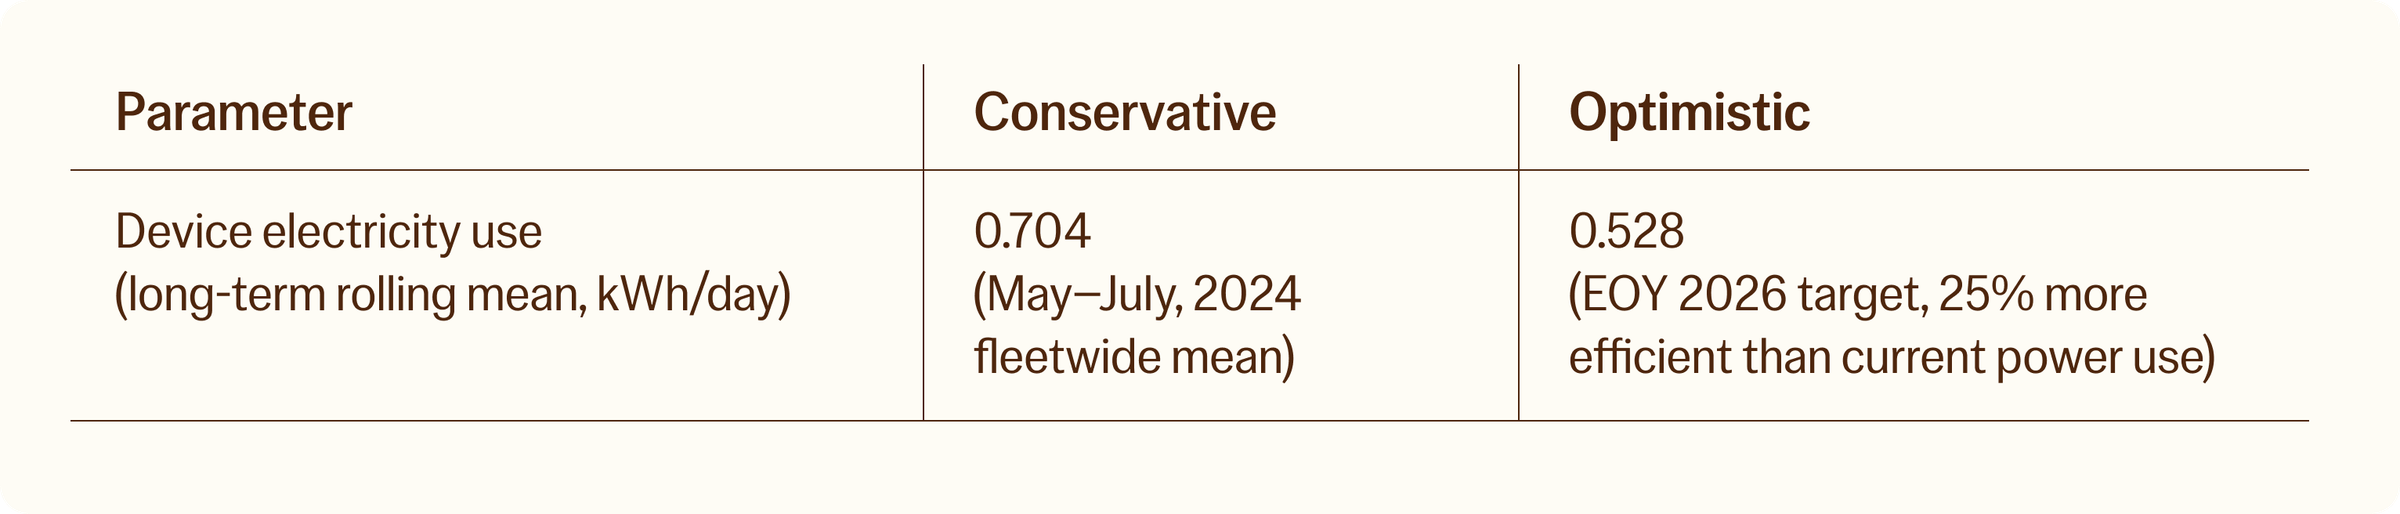
Device electricity use
Electricity consumption varies with usage behavior and the amount of food scraps added. The 2025 model bases this assumption on a power use analysis carried out on 43,000 dry-and-grind cycles between May and July, 2024, randomly sampled from active Mill bin users.
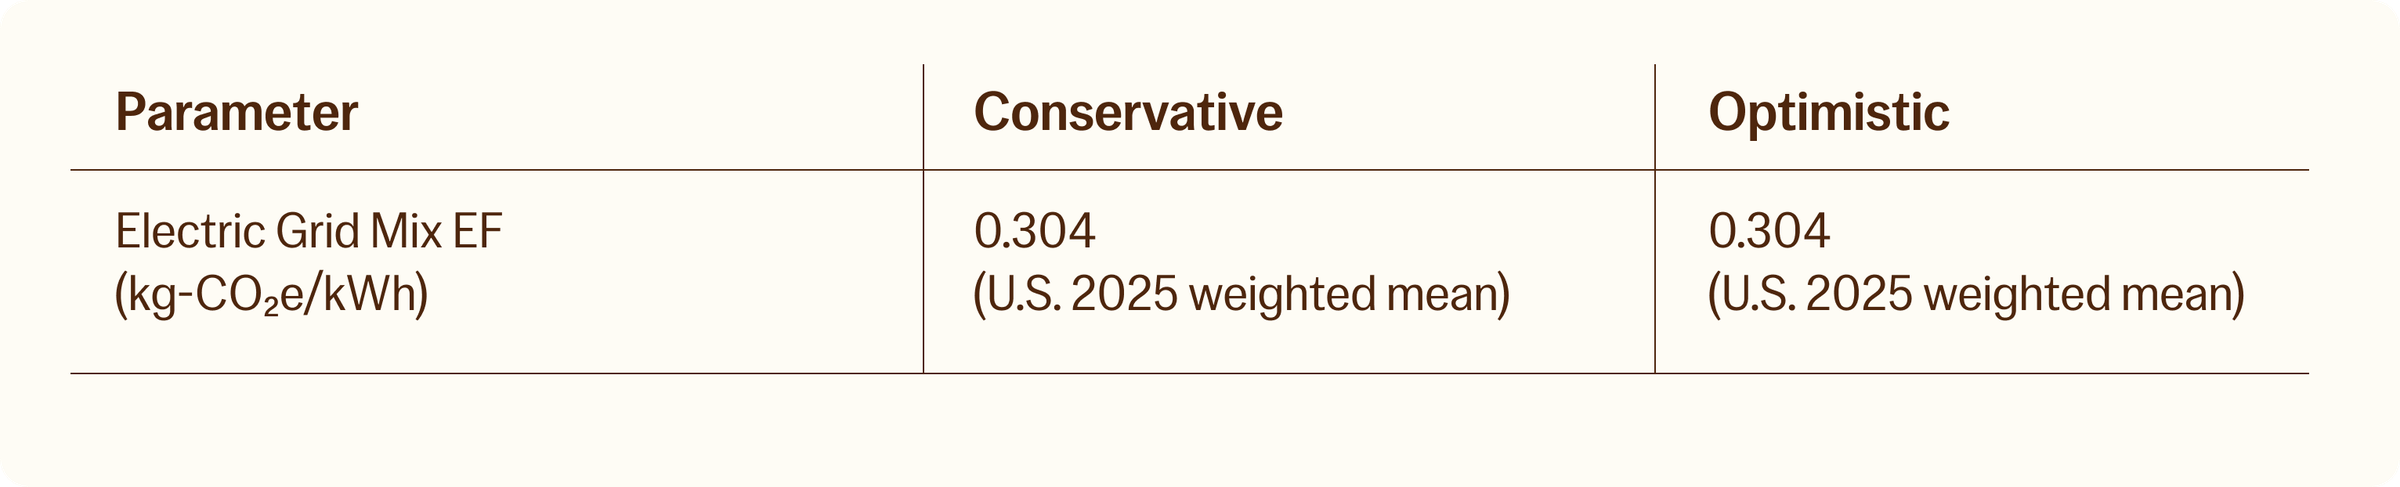
Local grid energy mix
The proportion of a Mill member’s local electric grid mix that is fossil-derived energy affects the emissions of using the Mill Food Recycler. Although the grid is becoming progressively cleaner over time, this is a slow process. Households do have the power to significantly reduce the footprint of bin electricity use, and of their home overall by purchasing renewable electricity. For conservatism, enrollment in renewable energy was not considered in the 2025 model (i.e. the average grid mix was used).
For both the conservative and optimistic scenarios, we used the 2022 state-based EPA eGRID emission factors. A single nationwide grid mix emission factor was calculated by taking the weighted average of state-based emission factors and the relative proportion of Mill customers in each of the continental U.S. states. Although the grid energy mix will likely become cleaner than it was in October, 2024 by the end of 2026, the same value is used for both scenarios for conservatism.
Landfill methane
Because landfilling food scraps is so impactful, care was taken to fairly develop the underlying calculations. The food waste landfilling calculations are highly sensitive to numerous assumptions. The table below includes some of the key assumptions. Above the assumptions, the calculations carried out in the model are shown. They include the impact not only of fugitive emissions but also of methane oxidation within the near-surface of the landfill, landfill gas capture and flaring, and landfill gas-fired electricity generation.
Two of the key studies referenced in the calculations were:
The following calculations are applied to estimate carbon avoidance from keeping food out of landfill:
(kg of food scraps generated by household per year) * (% food scraps were landfilled in the counterfactual scenario) = (kg food scraps landfilled per year)
(kg food scraps landfilled) * (1 - % Moisture Content of food scraps) = (kg of food scraps dry matter)
(kg of food scraps dry matter) (Weight % of food scrap dry matter is carbon) (Weight % of carbon is converted to methane) = (kg of methane generated)
(kg of methane generated) (% of landfills with gas capture) (% of methane captured by landfills with gas capture) = (kg of methane captured)
(kg of methane generated) * (% of methane generated that is oxidized before reaching landfill surface) = (kg of methane oxidized)
(kg of methane generated) - (kg of methane captured) - (kg of methane oxidized) = (kg of methane released)
(kg of methane released) * (kg CO2e / lb methane released) = (kg CO2e from landfilled food scraps methane release)
(kg of food scraps landfilled) (1 short ton / 907.2 kg) (% of landfills have gas capture systems with electricity generation) (kWh / ton food scraps landfilled) (grid electricity mix carbon avoidance / kWh generated) = (kg CO2e credit from electricity generation)
(kg of food scraps dry matter) (Weight % of food scrap dry matter is carbon) (Weight % of carbon remains sequestered in the landfill indefinitely) * (kg CO2e / kg C) = (kg CO2e credit from food scraps carbon that remains sequestered in the landfill)
(kg CO2e from landfilled food scraps methane release) - (kg CO2e credit from electricity generation)
(kg CO2e credit from food scraps carbon that remains sequestered in the landfill) = (Net kg CO2e from landfilling food scraps)
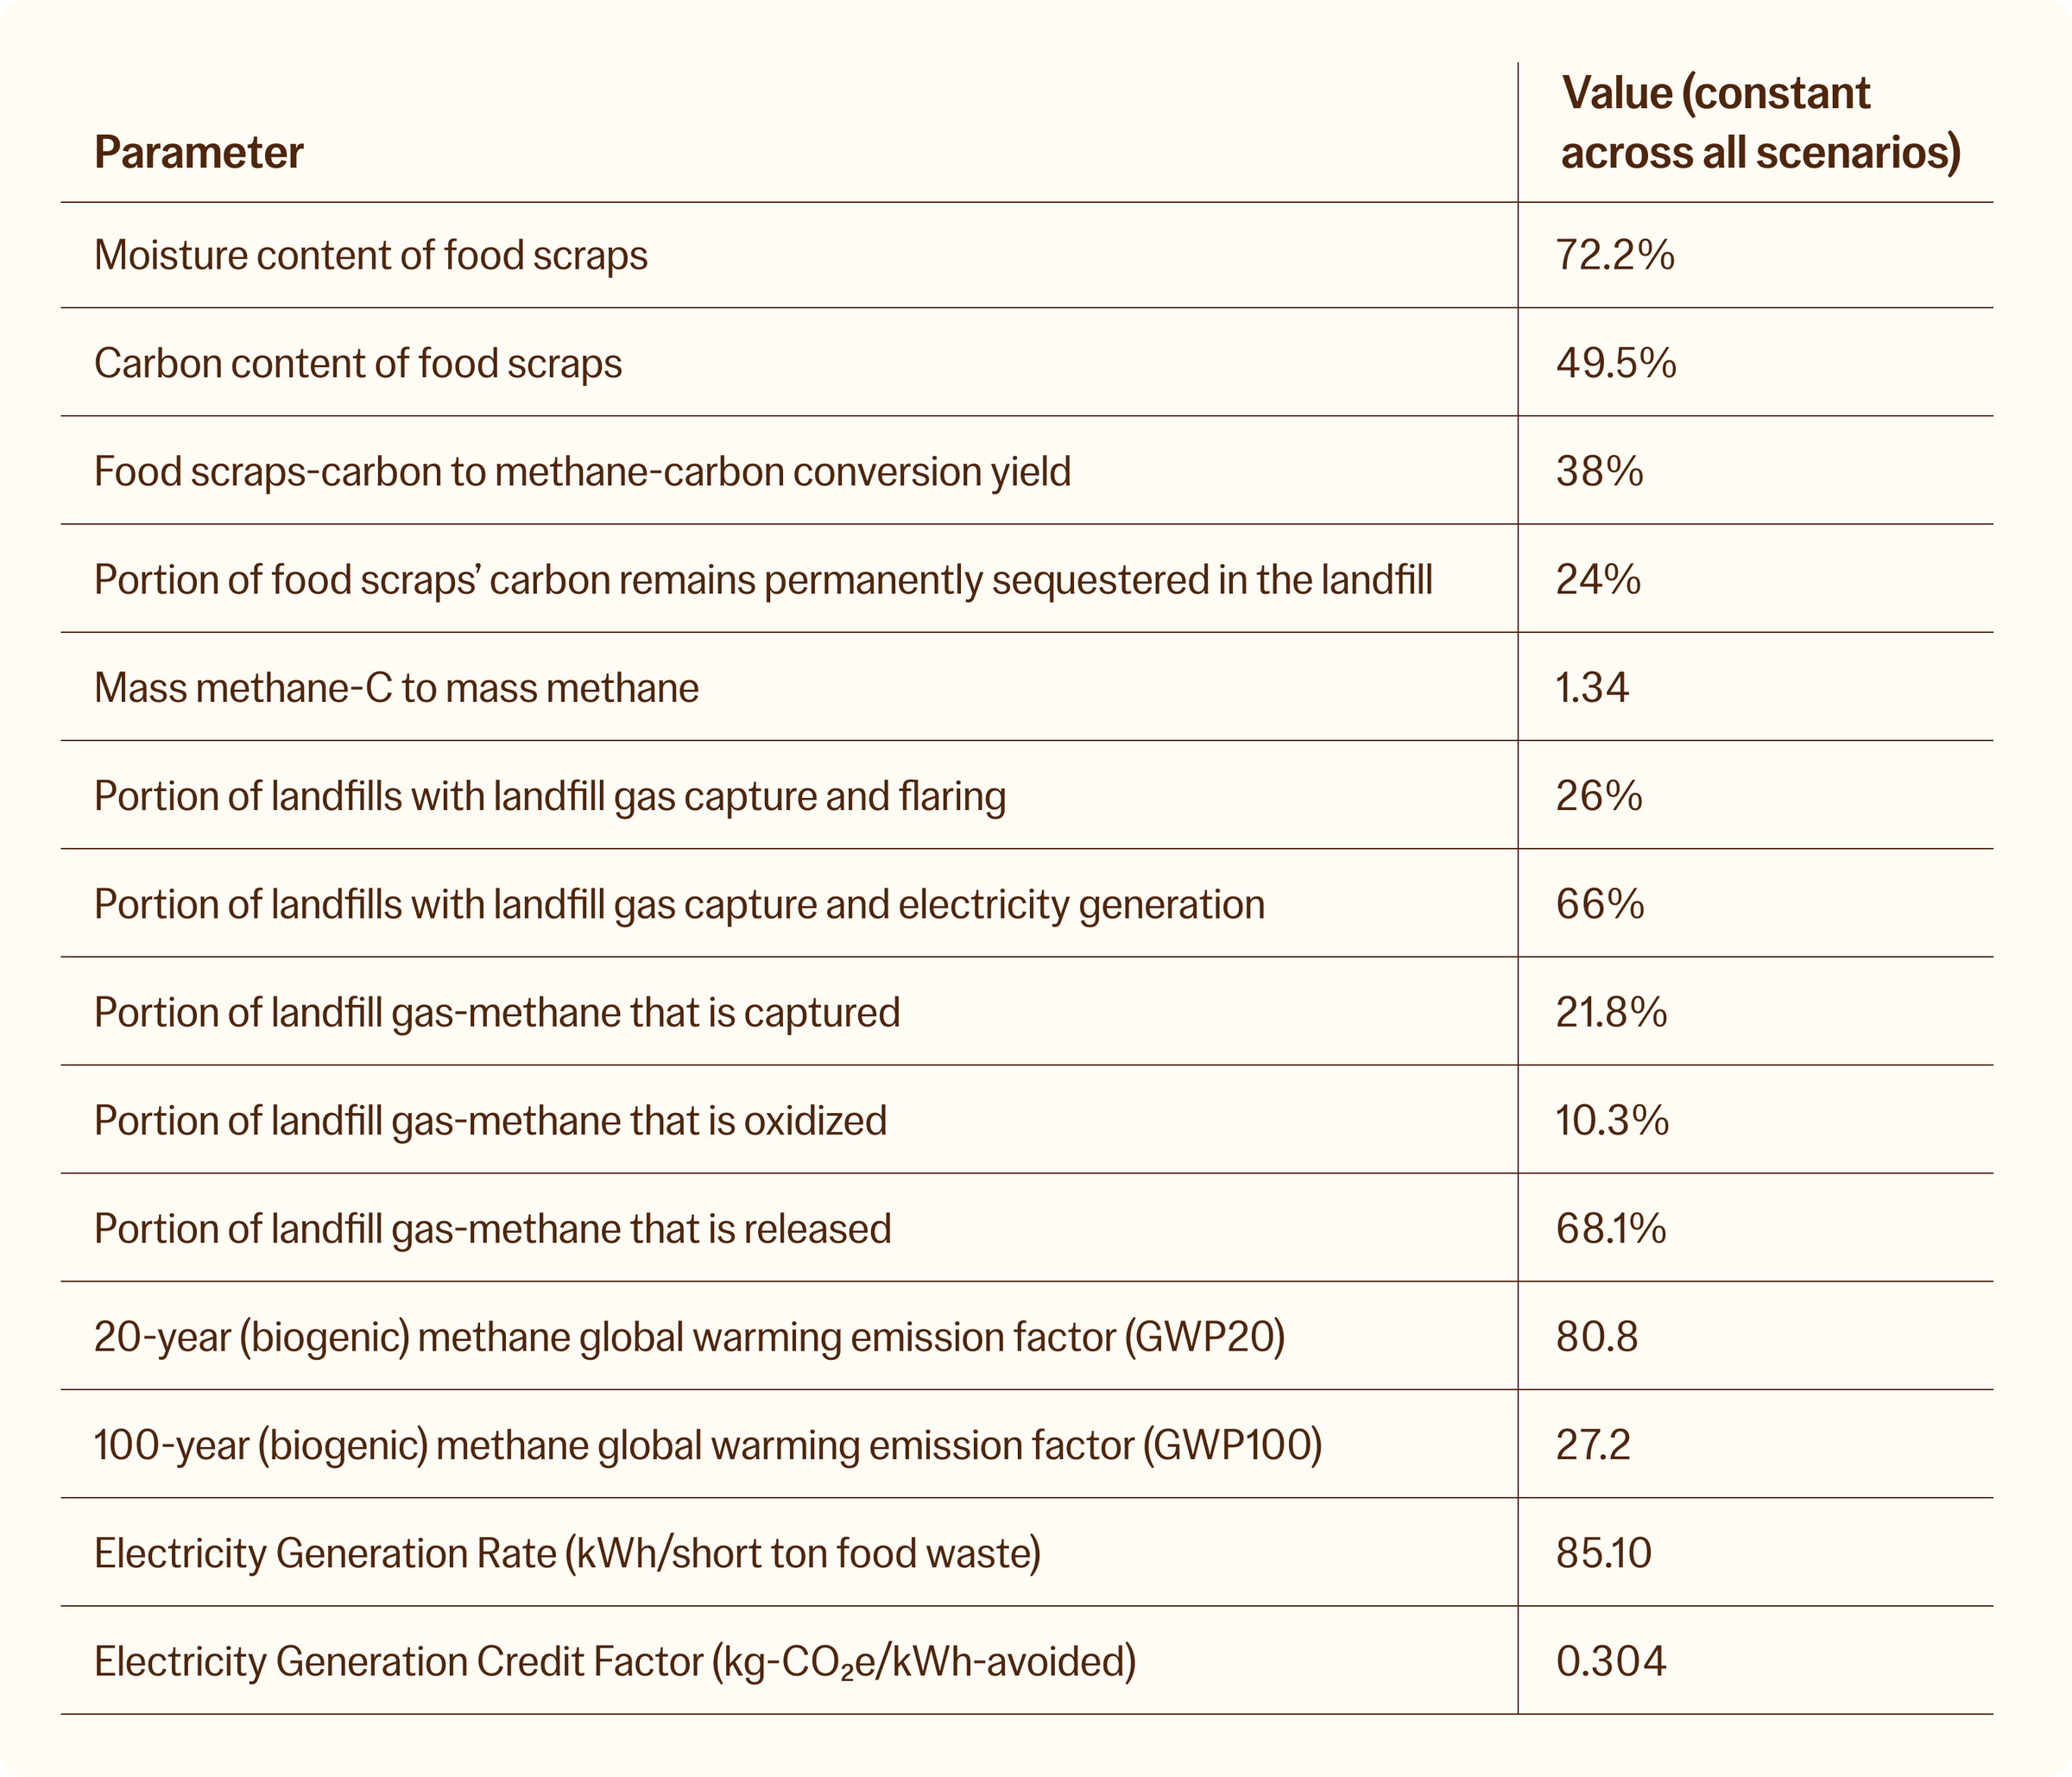
*The portions of methane captured, oxidized, and released are calculated in alignment with EPA’s October 2023 report, Quantifying Methane Emissions from Landfilled Food Waste, by manually integrating the quantities of methane generated, oxidized, captured, and released year-over-year over a 30-year period. The respective summed values of oxidation, capture, and release were divided by the summed value of landfill gas generated.
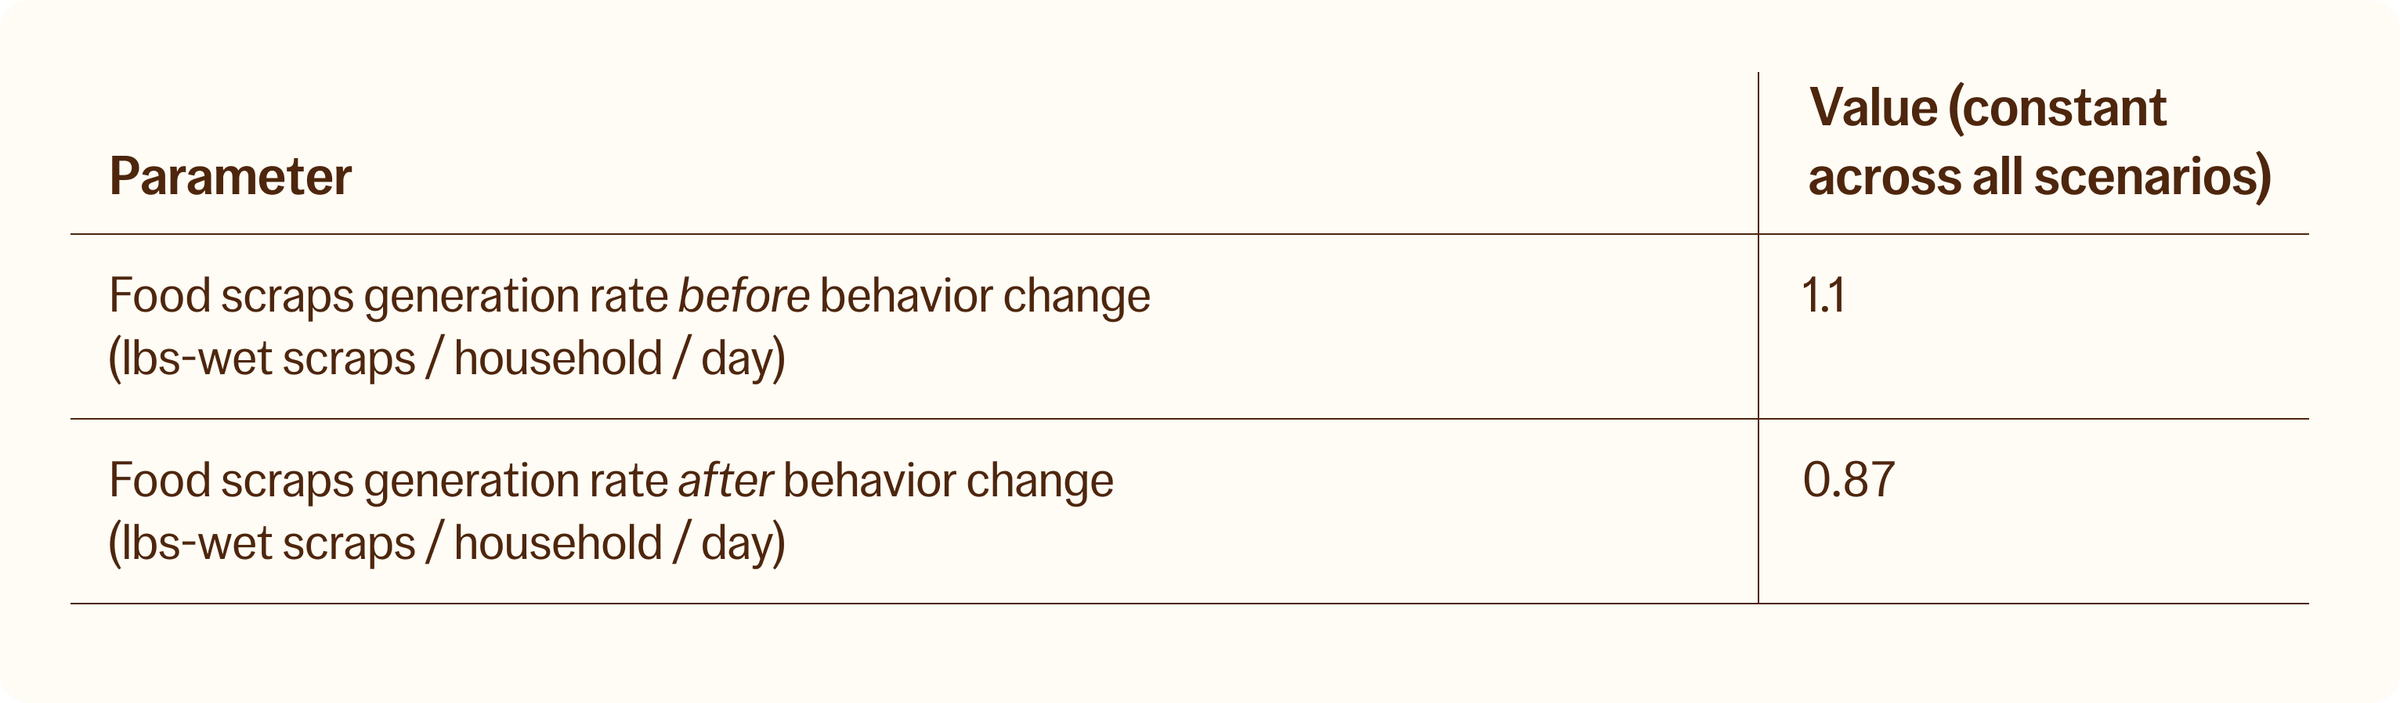
Food scraps generation rate
The amount of food scraps generated per person and the number of people in a household affect this rate. If a Mill customer lives alone or travels a lot, they could have a lower food scrap generation rate per device per day. The 2025 model assumes 1.1 lbs of food scraps / household / day, before behavior change, based on a significant body of field data. After three months of bin use, this reduces to 0.87 lbs / household / day (reflecting the post-behavior change generation rate).
Counterfactual fate of food scraps
For the base case scenario, the 2025 model assumes food scraps were managed in alignment with the U.S. average food scraps management mix, according to 2019 EPA data. The specific scraps management mix is:
66.2% of scraps are landfilled
15.1% of scraps are incinerated (sent to waste-to-energy facility)
3.7% of scraps are commercially composted
15% of scraps are sent down the drain (via the sink or sink garbage disposal)
The 2025 model is structured to enable the assessment of alternative counterfactual scenarios, to tailor the math to specific use cases (such as 100% of food scraps being landfilled). See section below for impact estimates of alternative scenarios.
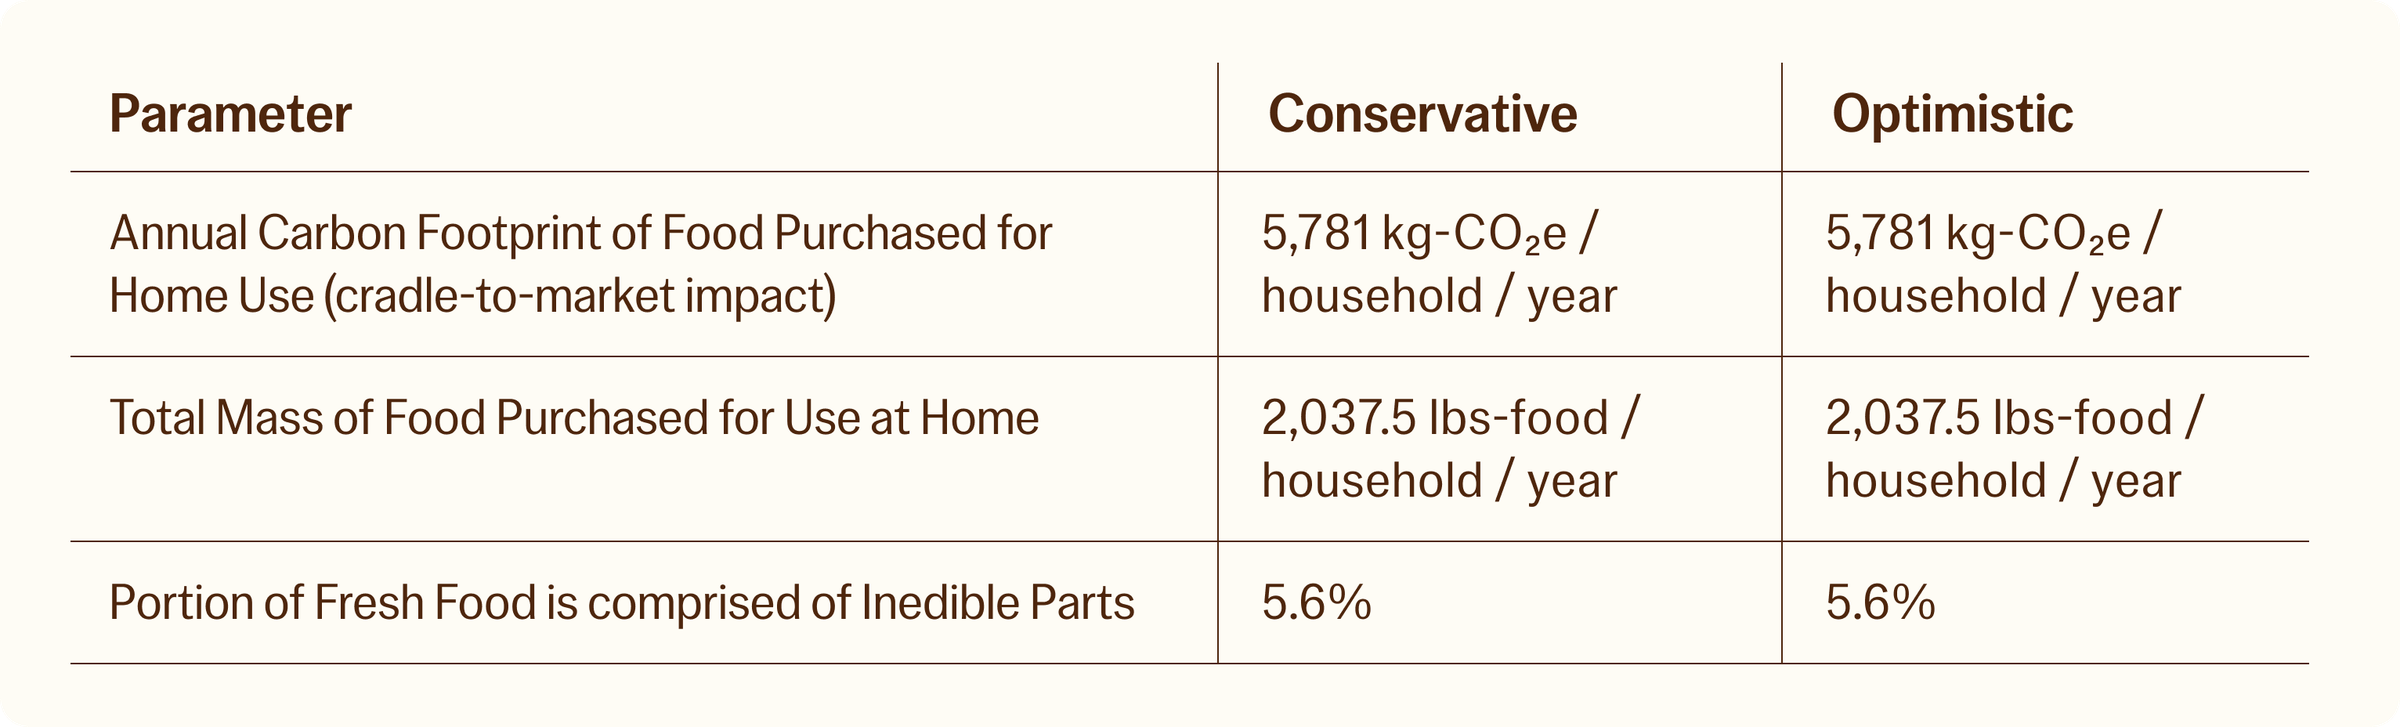
Source reduction
To estimate the impact of source reduction, a calculation is needed to translate the observed reduction in food scraps added to the bin (assumed to be a reduction in food scraps generated) to a reduction in the mass of food purchased. The math suggests a 21% reduction in scraps generation corresponds to a 4.4% reduction in mass of food purchased, which corresponds to a carbon avoidance of 258 kg-CO2e / household / year.
This works by assuming that the amount of inedible food scraps generated remains the same during behavior change. So, for example, if a person generated 5 banana peels a week before getting Mill, they will continue to generate 5 banana peels a week after having Mill for a few months. Thus, the lesser mass of scraps going into the bin is edible food parts that are now eaten rather than being tossed, and this is edible food that no longer needs to be purchased at the store.
Sensitivity Analysis
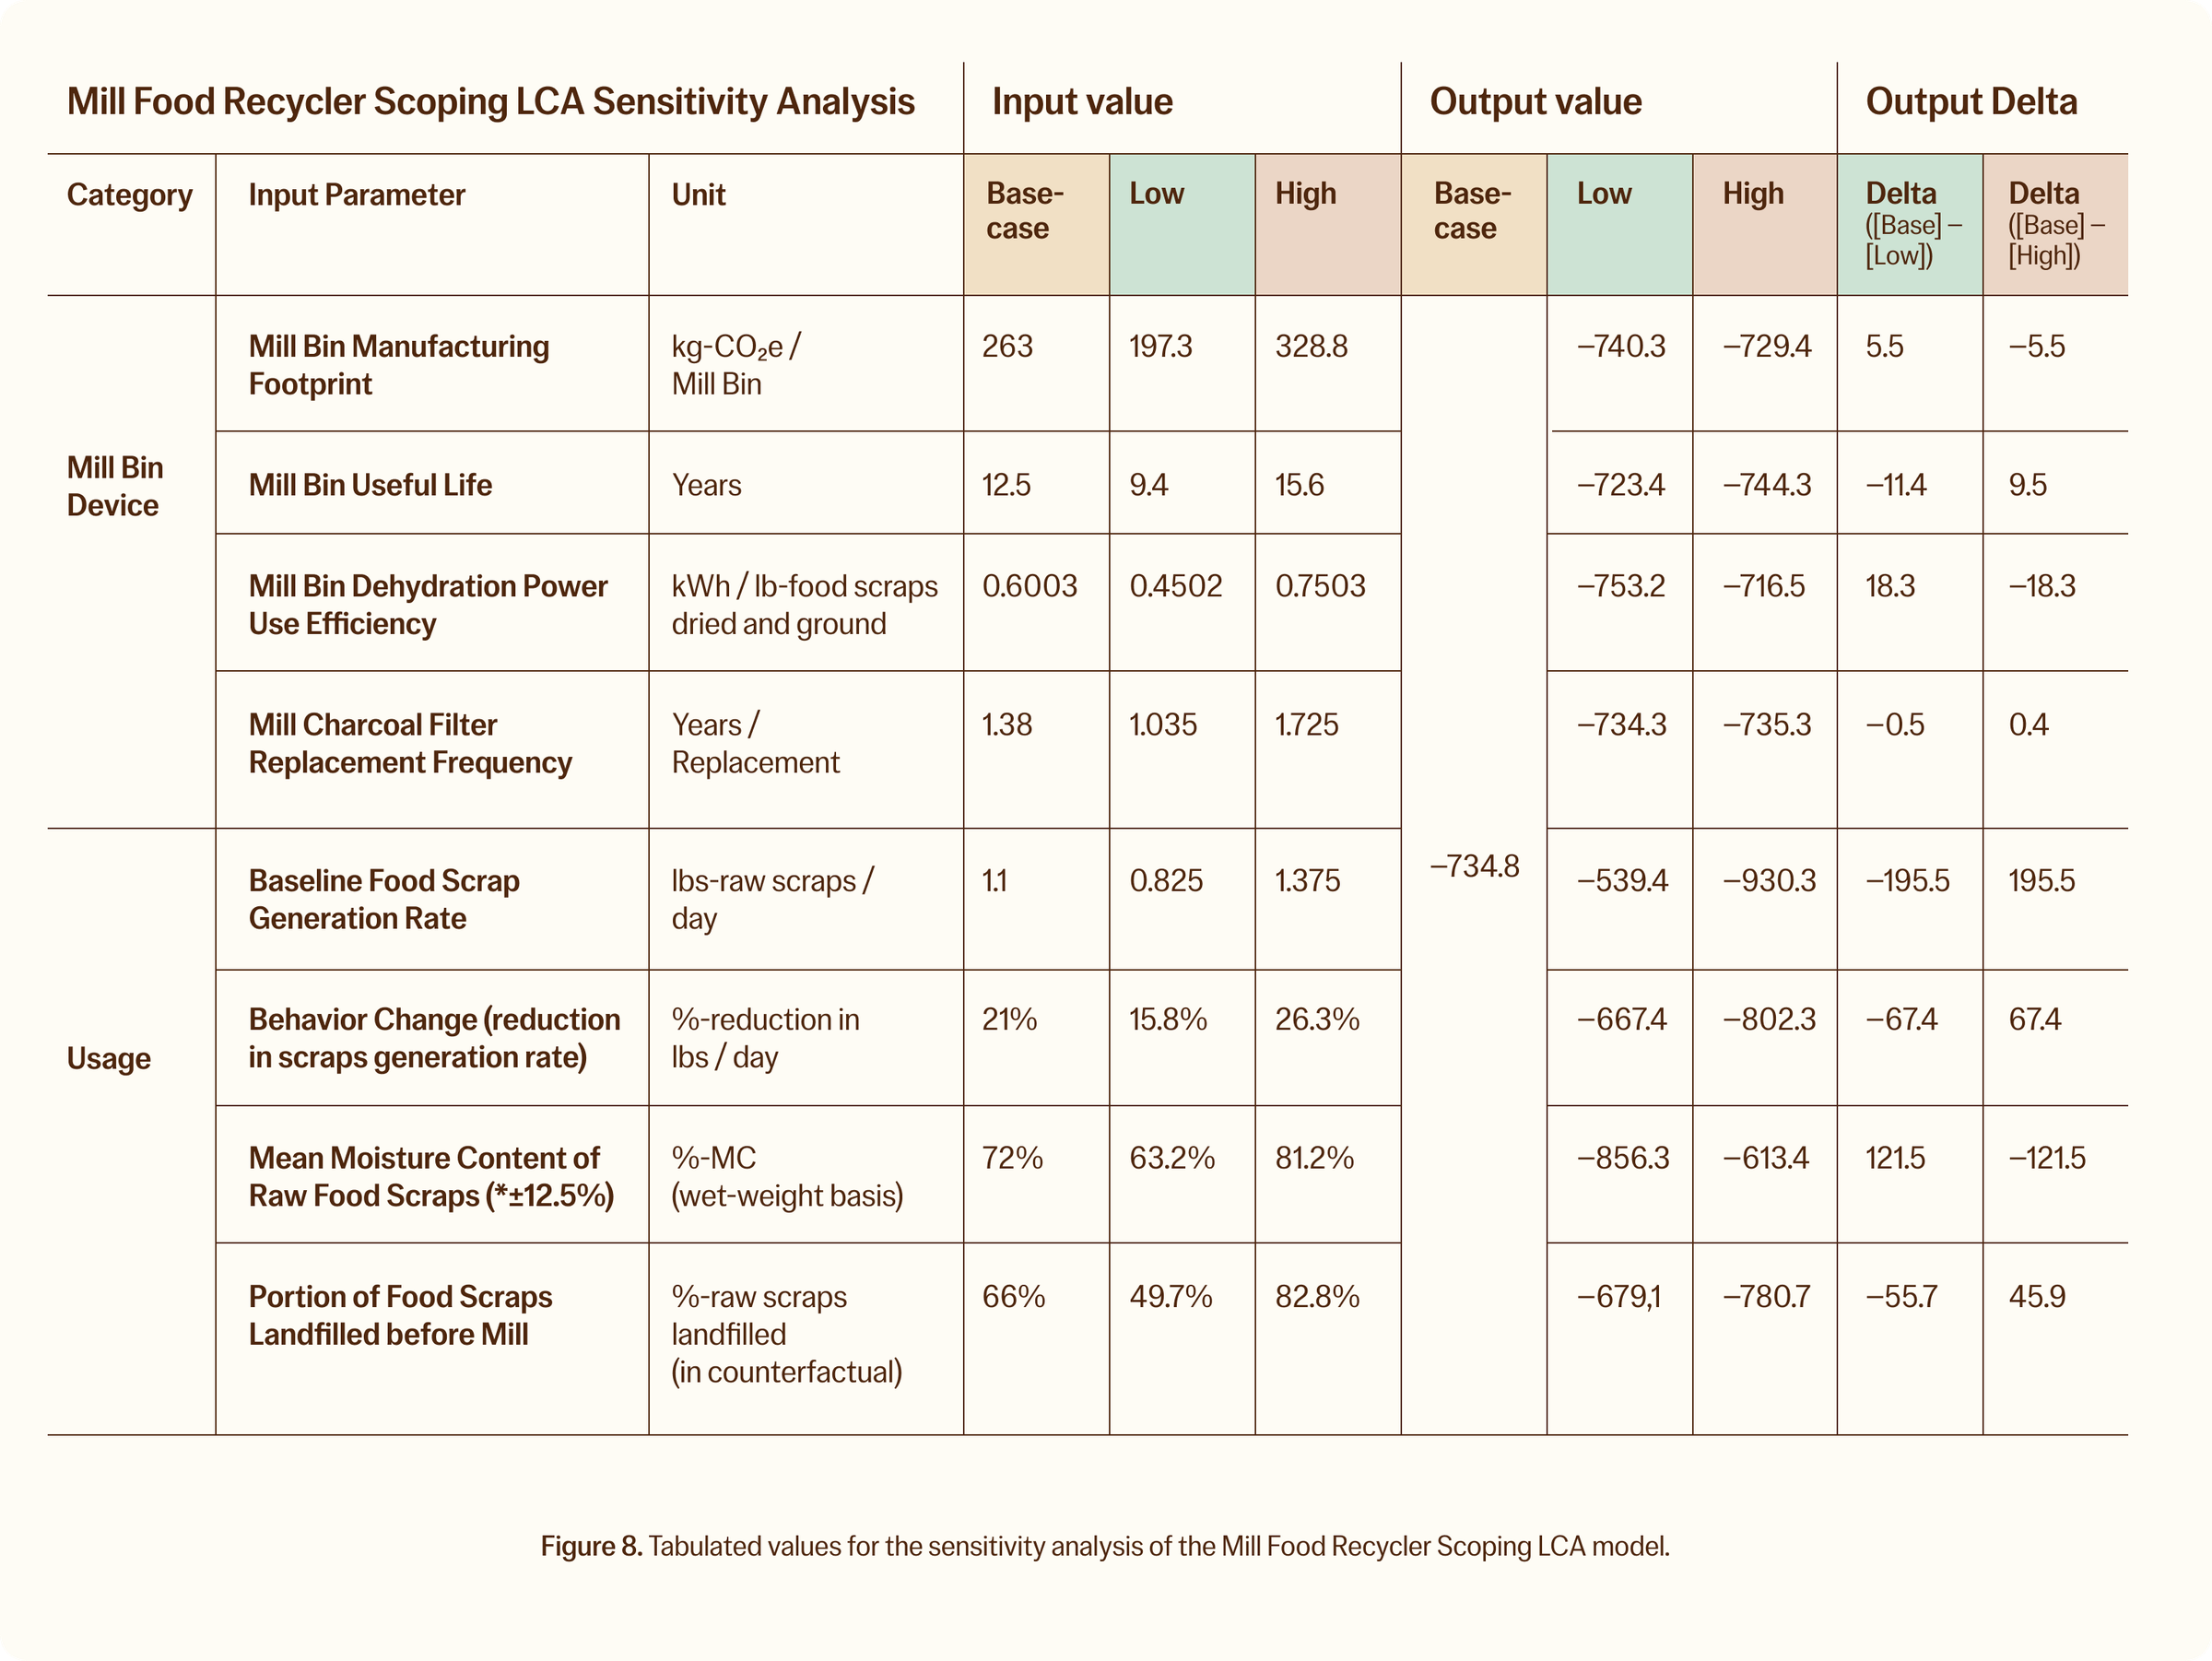
A sensitivity analysis was conducted to understand the relative sensitivity of estimated annual emissions avoidance to key model inputs.
The analysis was carried out by initializing the model to represent the base case scenario. The base case scenario attempts to reflect the typical American household in terms of their diet, food scrap generation behavior, food scrap management behavior, and the typical behavior change with Mill. With the base case setup, a series of input values were varied, one at a time. The output (estimated annual carbon avoidance) value was recorded after each variation.
For comparability of input value sensitivity, inputs were varied by a standardized value of + / - 25% (percent, not percentage points). To establish the “low” values, the input value was multiplied by 0.75, to establish the “high” values, the input value was multiplied by 1.25. The only case where this deviated from was the raw food scrap wet weight moisture content, where the base case value of 72.2% was multiplied by 0.875 to get the low value and 1.125 to get the high value. This was done because dry matter content changes significantly with a very small change in wet-weight moisture content, particularly when that moisture content is high. For example, a change from 75% to 87.5% moisture content would halve the dry matter content.
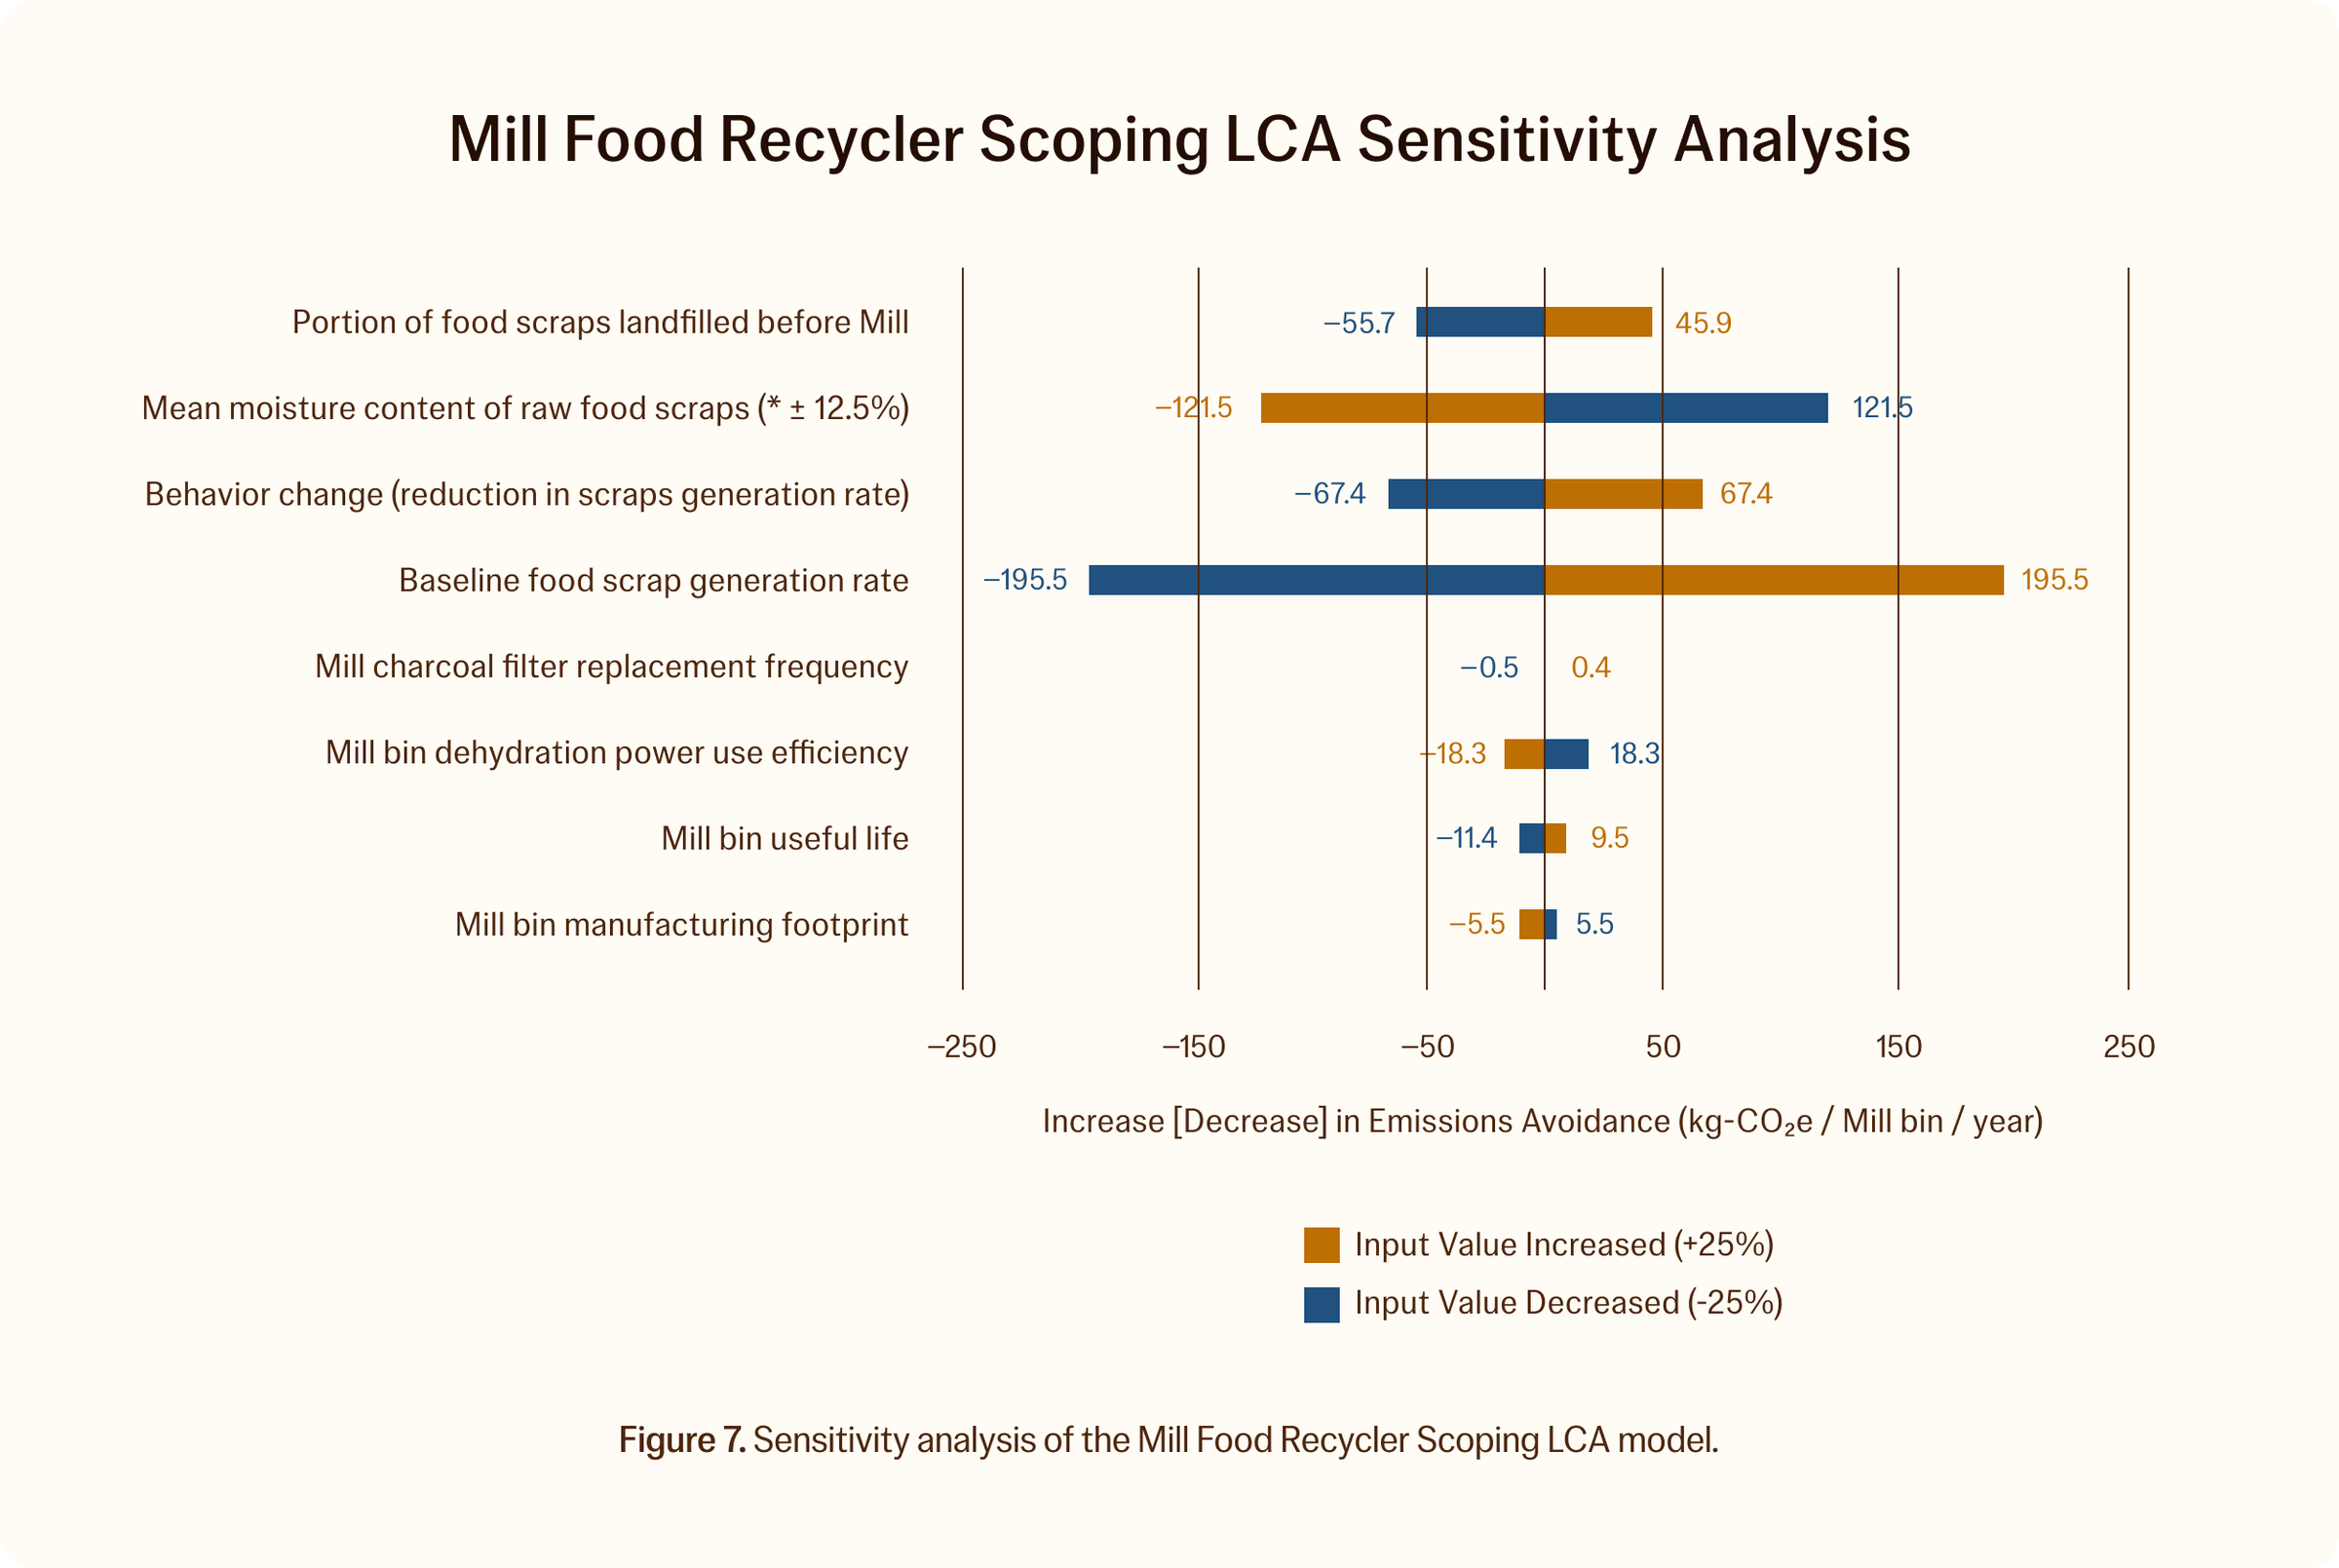
As is clear from the analysis, the LCA model is most sensitive to the baseline daily weight of food scraps generated. This is logical because improved scraps management is directly proportional to the amount of scraps that were wasted before, which are being beneficially used with Mill. In other words, Mill reduces the impact of food scraps management, and thus Mill can only help reduce this impact by (it is constrained to reducing it by) as much as the impact of managing the quantity of scraps generated before Mill. If a large household generated a lot of food scraps before, their behavior before Mill resulted in more emissions than a smaller household which generated less food scraps.
Beyond the baseline (counterfactual) food scraps generation rate, the 2025 model is most sensitive to:
The extent of behavior change that takes place (specifically the amount by which scraps generation decreases following the adoption of Mill)
The moisture content of food scraps (which is typically outside of the control of the household)
The portion of food scraps that were landfilled before Mill
Mill has attempted to account for these sensitivities by conservatively structuring the base case scenario. Daily mass additions of food scraps to the bin (and the percent reduction of mass added over time) were derived from more than a year’s worth of daily mass additions from thousands of bins. The raw food scraps moisture content value references EPA WARM v16 (72.2%) - which is lower than other studies suggest (80%), a conservatism for carbon avoidance. The portion of food scraps landfilled before Mill figure references the latest EPA data.
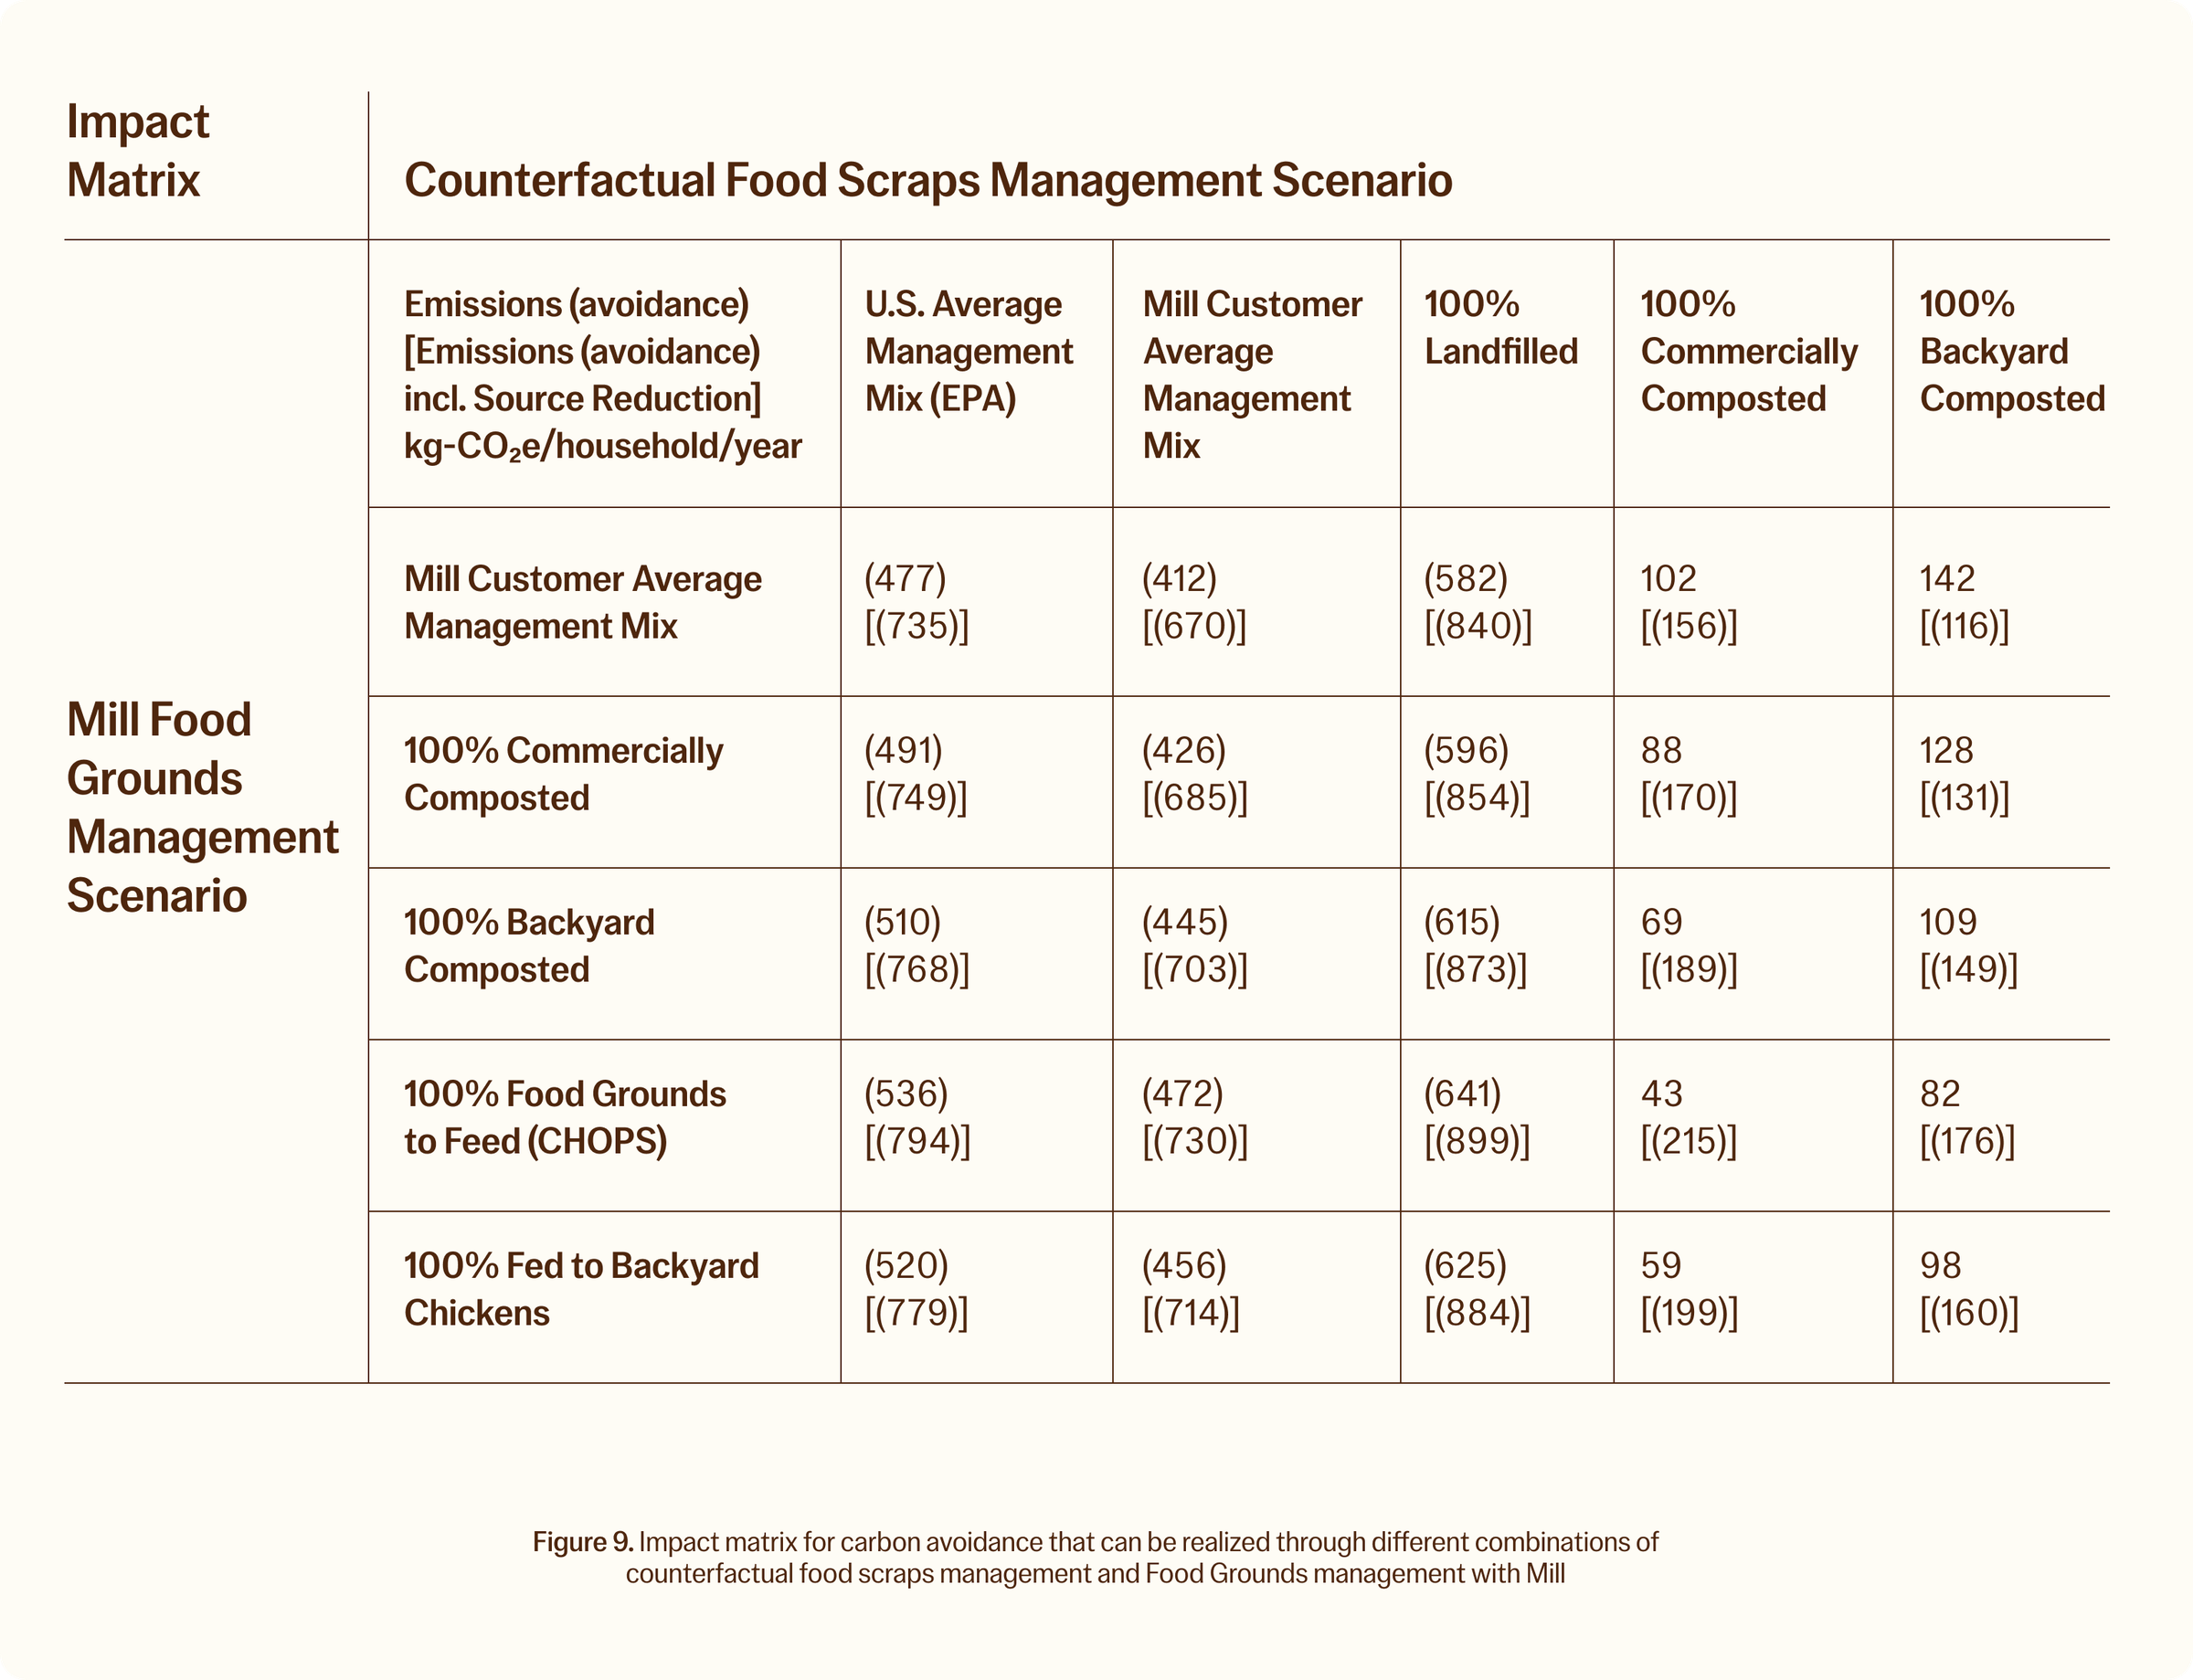
Impact Matrix
Below is a matrix showing a series of counterfactual scraps management x Mill Food Grounds management scenarios. There are two sets of values included:
The estimated carbon impact resulting from improved scraps management with use of the Mill bin
The estimated carbon impact from both improved scraps management and source reduction*.
*The source reduction calculation estimates that a 21% reduction in mass additions to the bin over the first three months of bin use corresponds to a 4.4% reduction in purchases of food for home use.
Negative values (those in parentheses) are avoided emissions, positive values are additional emissions.
For the scenarios where 100% of food scraps were commercially- or backyard-composted, there are additional emissions when adopting the Mill bin, when source reduction is not included. This is because no landfill avoidance can be accounted for.
Balcombe et al, 2018, Methane Emissions: Choosing the Right Climate Metric and Time Horizon - Contains rhetoric on the use of 20- and 100-year global warming potentials.
Ecoinvent 3 LCA Database - Used the database to quantify the climate impact of Mill Food Recycler bill of materials (BOM) and manufacture.
EPA Emission Factors Hub - Referenced common emission factors, such as transportation ton-mile emission factors.
EPA eGRID - Referenced state-based mean electric grid mix emission factors. Applied state-based factors to Mill customer distribution to establish a weighted-average nationwide grid mix emission factor.
From Field to Bin: The Environmental Impacts of U.S. Food Waste Management Pathways (Part 2) - Referenced emission factors for food scrap management methods.
EPA WARM 2023 v16 (Waste Reduction Model) - Referenced assumptions and calculations on landfill and compost facility dynamics.
EPA Quantifying Methane Emissions from Landfilled Food Waste (2023-10) - Referenced assumptions and calculations on the dynamics of food waste decay in the landfill
EPA Wasted Food Measurement Scoping Memo - Referenced data on the physical and chemical properties of food scraps.
EPA 2019 Wasted Food Report - Referenced for the typical U.S. household manages their food scraps
FAO GLEAM (Quantification Guidelines for Environmental Performance of Feed Supply Chains and ReCiPE LCA DB) - Referenced for the relative impacts of grain agriculture, feed production, and animal agriculture (for the production of grain-based poultry feed).
GFLI ReCiPE EF2 - Referenced the LCA database for ingredient-level emission factors
IPCC AR6 (Sixth Assessment Report) -Referenced global warming potential emission factors for non-CO2 greenhouse gases.
NRDC Estimating Types and Quantities of Food Waste at the City Level - Referenced residential food waste behavior data.
ReFED Insights Engine Food Waste Monitor (and associated Methodology) - Referenced emission factors and methane emissions associated with food scrap management methods.
SJAPCD TAP 11-01 Aerated Static Pile Composting with Surface Biofiltration Layer Air Emissions Control Air Emissions Assessment - Referenced data on windrow and aerated static pile compost facility CO2, methane, and nitrous oxide emissions.
The Production of Activated Carbon from Coconut Shells using Pyrolysis and Fluidized Bed Reactors - Referenced the carbon balance associated with the manufacture of activated carbon in a fast pyrolysis + steam activation process to determine the emissions and carbon sequestration associated with activated carbon (filter media) production and use.
Verra Carbon Accounting Methodology VM0046 - Methodology for Reducing Food Loss and Waste - Referenced emission factors for food scrap management methods